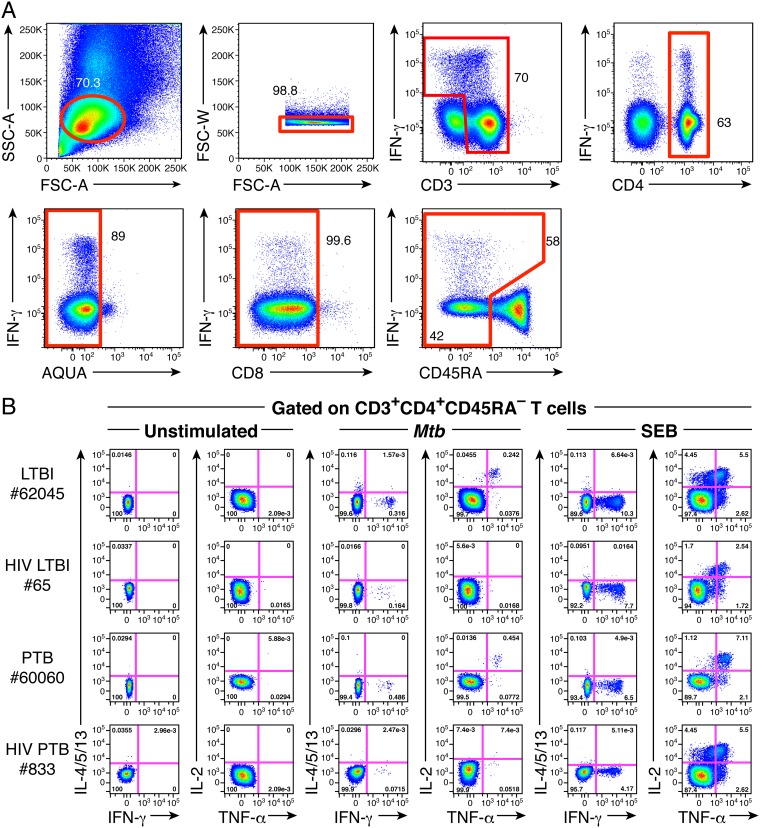
FIG 1.
Assessment of M. tuberculosis-specific CD4 T-cell responses. (A) Gating strategy used to assess cytokine-producing CD4 T cells. (B) Representative flow cytometry profile of M. tuberculosis-specific CD4 T cells producing IFN-γ, IL-4/5/13, TNF-α, and/or IL-2 of individuals with LTBI (62045), HIV/LTBI (65), PTB (60060), or HIV/PTB (833). Cytokine profiles of CD4 T cells stimulated with SEB (positive control) or left unstimulated (negative control) are also shown.

