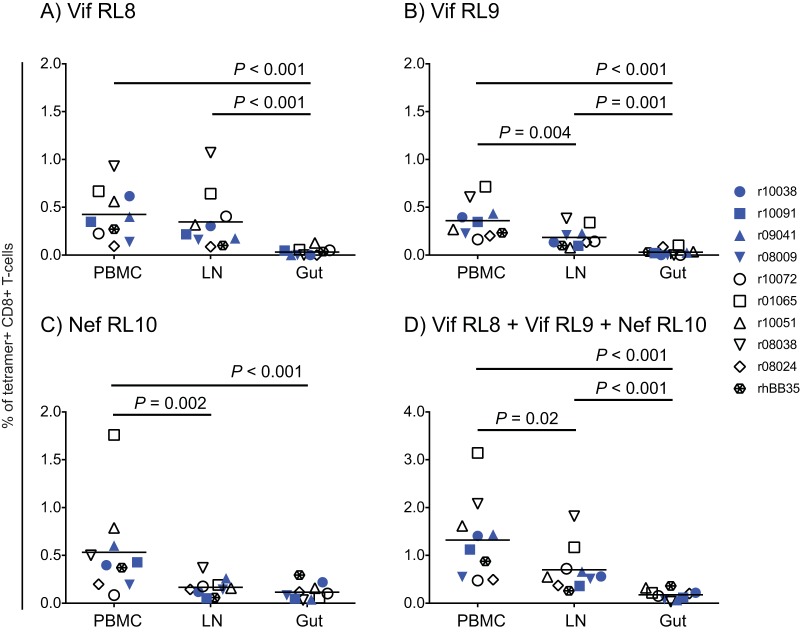
FIG 4.
Tissue distribution of vaccine-induced CD8+ T cells against Mamu-B*08-restricted SIV epitopes. (A to C) The frequencies of vaccine-elicited CD8+ T cells against Vif RL8 (A), Vif RL9 (B), and Nef RL10 (C) were quantified in PBMC and disaggregated lymphocyte suspensions obtained from lymph node (LN) and gut (colon plus rectal) biopsy specimens by fluorochrome-labeled MHC-I tetramer staining. (D) The combined frequencies of Vif RL8-, Vif RL9-, and Nef RL10-specific CD8+ T cells in each tissue are shown. The samples for this analysis were harvested at week 37 after rAd5 prime. Lines represent means. The P values were determined by repeated-measurement ANOVA. Vaccinees are color coded as described in the legend of Fig. 2.

