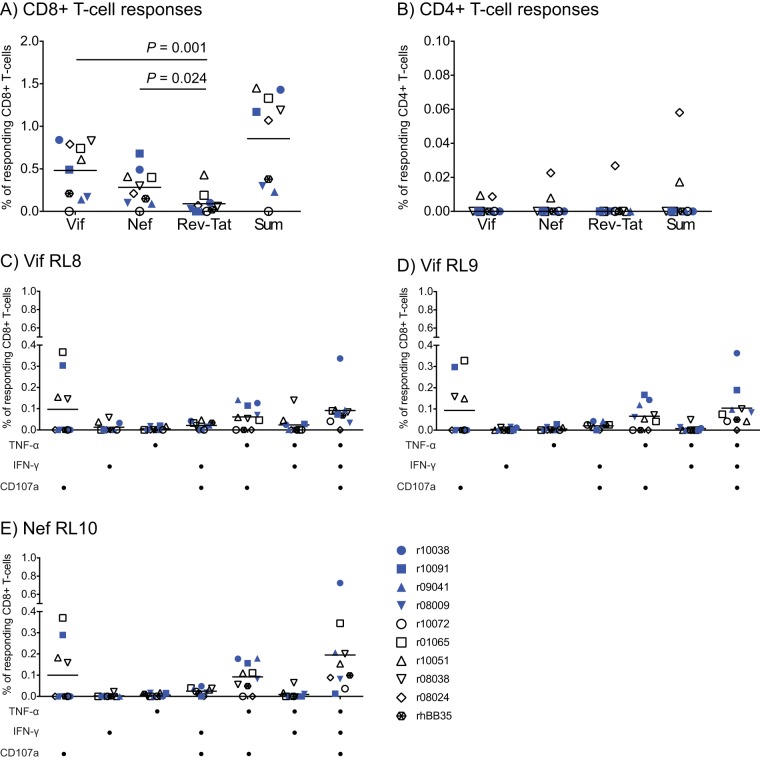
FIG 5.
Total magnitude and functional profile of vaccine-induced SIV-specific T-cell responses at the time of the first SIV challenge. These analyses were carried out in PBMC collected at study week 41. (A and B) CD8+ and CD4+ T-cell responses were measured by ICS using pools of SIVmac239 peptides (15-mers overlapping by 11 amino acids). The percentages of responding CD8+ (A) and CD4+ (B) T cells were calculated by adding the frequencies of positive responses producing any combination of three immunological functions (IFN-γ, TNF-α, and CD107a). Each panel shows the magnitude of T-cell responses against Vif, Nef, and both Rev and Tat and the sum of T-cell responses against these proteins. The P values were determined by repeated-measurement ANOVA. (C to E) Functional profile of vaccine-induced CD8+ T cells directed against Vif RL8, Vif RL9, and Nef RL10. ICS was used to evaluate the ability of vaccine-induced CD8+ T cells to degranulate (based on CD107a upregulation) and/or produce the cytokines IFN-γ and TNF-α upon stimulation. The antigen stimuli for this assay consisted of peptides corresponding to the Mamu-B*08-restricted epitopes Vif RL8 (C), Vif RL9 (D), and Nef RL10 (E). The combinations of functions tested are shown below each panel. The P values were determined by repeated-measurement ANOVA. Lines represent means. Vaccinees are color coded as described in the legend of Fig. 2.

