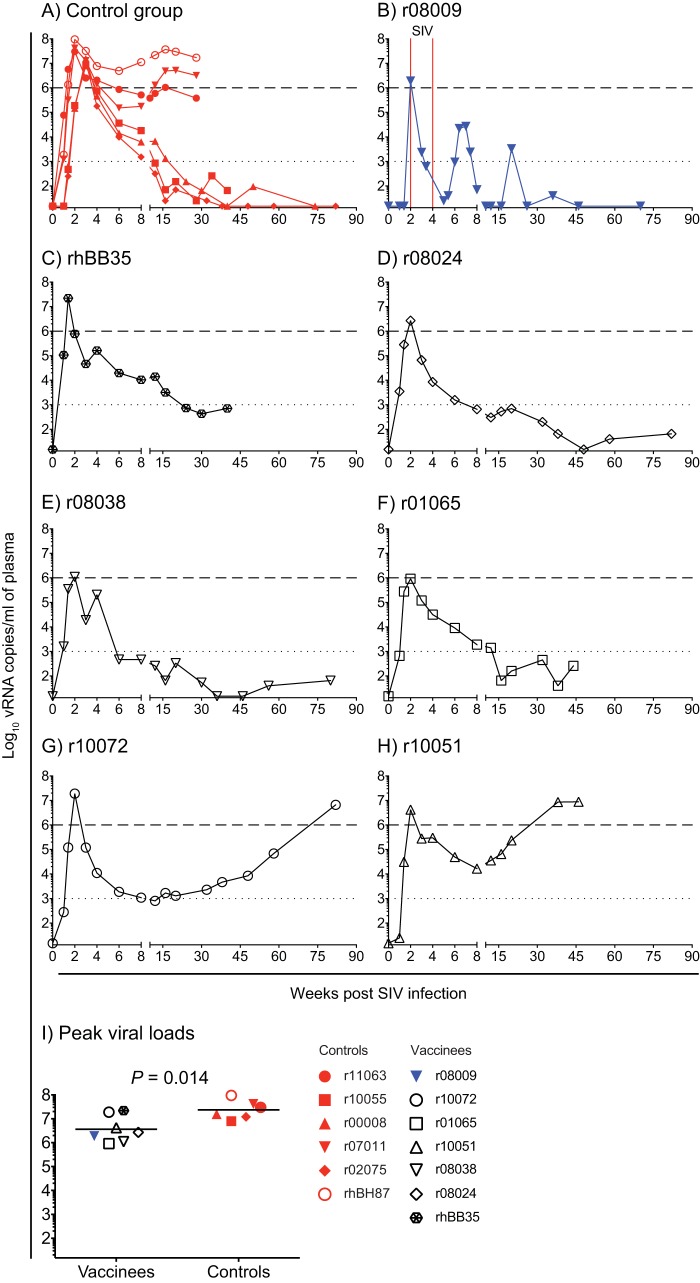
FIG 8.
Plasma virus concentrations after SIVmac239 infection. The viral loads of animals that acquired SIV infection were log transformed and correspond to the number of vRNA copies per milliliter of plasma. (A to H) Viral load traces for animals in the control group (A) or individual vaccinees that became infected (B to H). The dotted and dashed lines are for reference only and indicate VLs of 103 and 106 vRNA copies/ml of plasma, respectively. The two unintentional SIV challenges delivered to r08009 are indicated by vertical solid red lines in panel B. (I) Comparison of peak viral loads between SIV-infected vaccinees and control animals. The P value was calculated using Student's t test after log transformation. Lines correspond to geometric means, and each symbol denotes an animal. Monkey r08009 is color coded in blue because it manifested stringent control of chronic-phase viremia.

