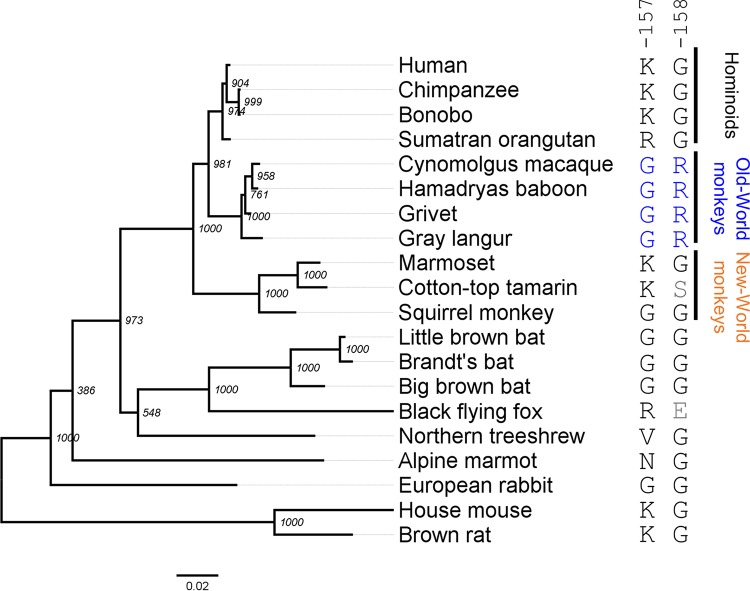
FIG 1.
ML tree of the 20 NTCP sequences analyzed in this study. An ML tree of 20 mammalian full-length NTCP sequences was reconstructed using PhyML 3.0. Bootstrap values from 1,000 replicates are indicated at each node. The scale bar indicates the number of nucleotide substitutions per site. The corresponding GenBank accession numbers are listed in Table 1. The indicated amino acid sequences correspond to the amino acids at residues 157 and 158 in each NTCP species.

