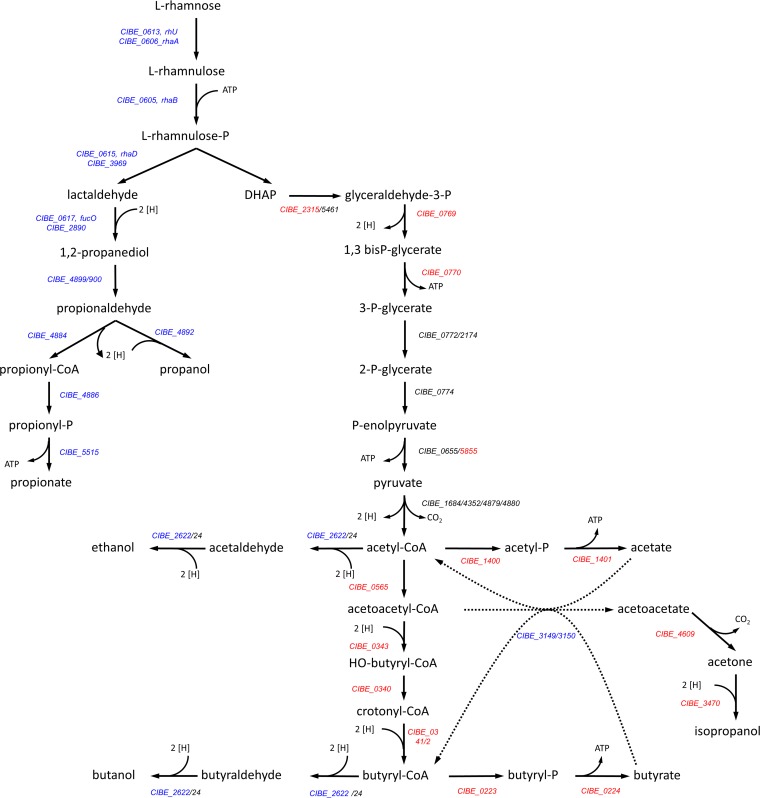
FIG 3.
Model for the metabolic pathway of l-rhamnose by C. beijerinckii. The gene functions are based on sequence homology as shown in Tables 2 and 3 for the l-rhamnose-metabolizing pathway and on data from Máté de Gérando et al. (16) for the other routes. Genes shown in blue are overexpressed on l-rhamnose compared to glucose. Genes in red showed lower expression in l-rhamnose cultures than in glucose cultures.

