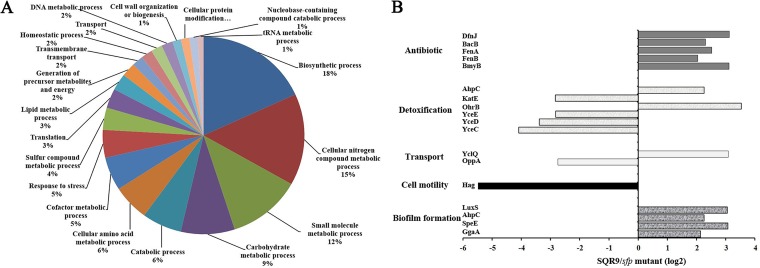
FIG 2.
The sfp mutant and wild-type strains showed different proteomic profiles by iTRAQ analysis. (A) Distribution in various functional categories of proteins altered in the sfp mutant strain. (B) Distribution of the rhizosphere proteins in the presence of various treatments. The abscissa shows the fold change in the protein ratio of two treatments (SQR9/sfp mutant), and the ordinate represents various indicated proteins.

