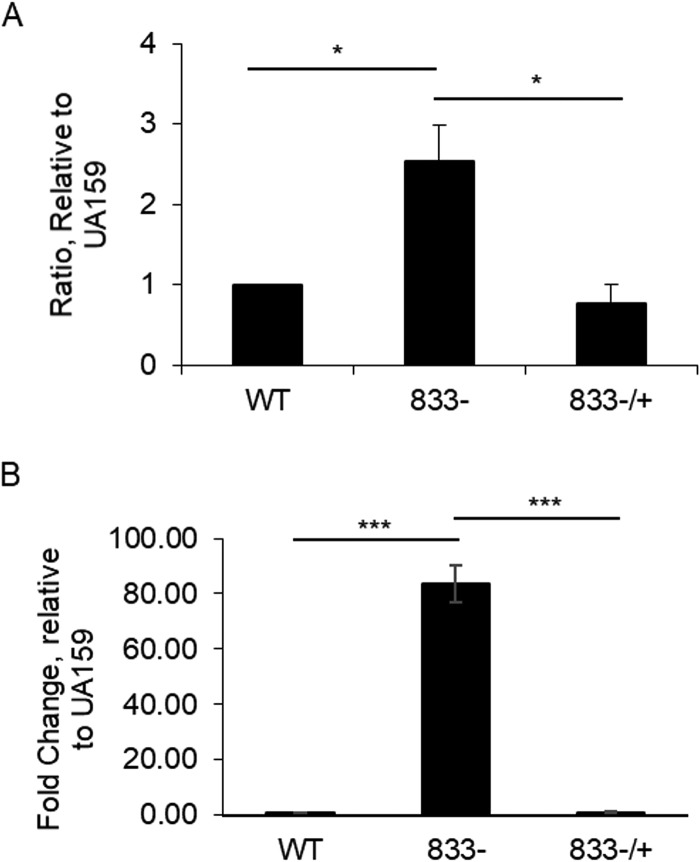
FIG 5.
Analysis of membrane vesicle production and DNA content. Membrane vesicle yield was estimated by measuring protein concentration using BCA assay. (A) Ratio of membrane vesicle production relative to S. mutans UA159. Data represent the average (±SD in error bars) values from three independent sets of experiments. *, P < 0.05 versus UA159. (B) DNA content of membrane vesicles was measured with real-time PCR using 16S specific primers. Results presented are representative of those from at least three independent experiments. ***, P < 0.001. Statistical analysis was done using Student’s t test.

