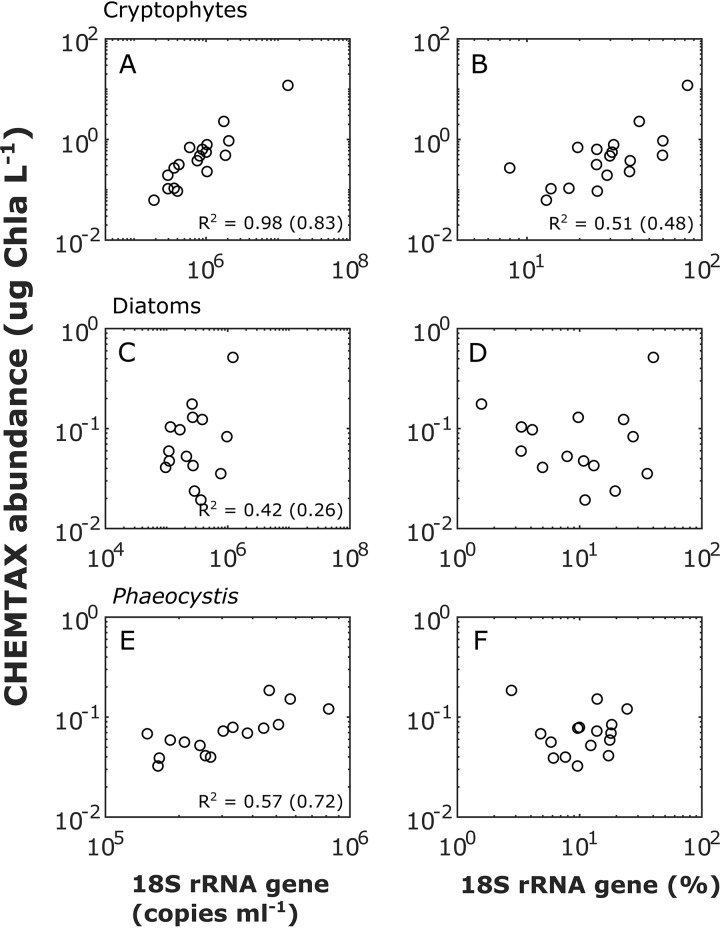
FIG 3.
Abundances of cryptophytes (A and B), diatoms (C and D), and Phaeocystis (E and F) estimated by 18S rRNA gene QMP (left panels) and RMP (right panels) compared to abundances estimated by CHEMTAX-HPLC pigment analyses. For significant correlations (P < 0.05), Pearson’s r2 values for original data and log10-transformed data (in parentheses) are shown at the bottom of the plot.

