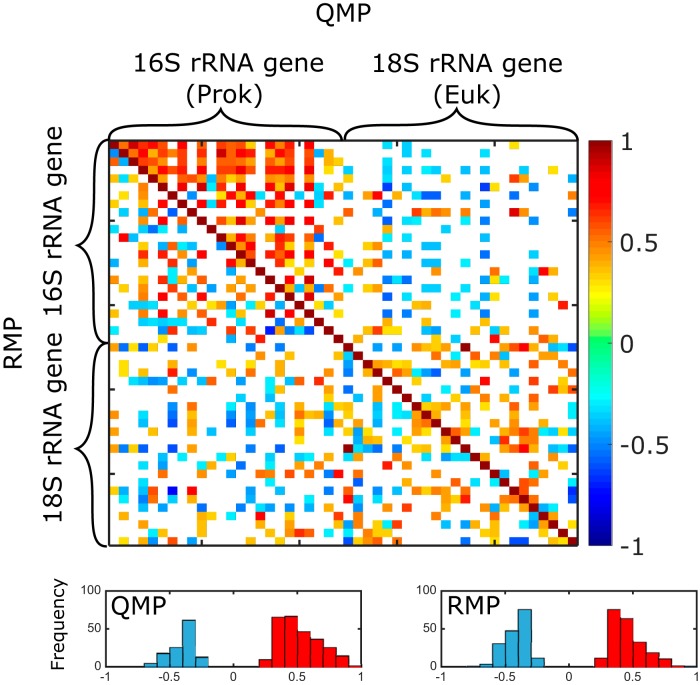
FIG 5.
Taxon cooccurrence matrices based on QMP (rRNA gene copies per milliliter) versus RMP (rRNA gene copy percentage). The top 24 most abundant prokaryotic (16S rRNA gene) OTUs and eukaryotic (18S rRNA gene) OTUs were used to construct the pairwise correlation matrices based on QMP (upper triangle) and RMP (lower triangle). Spearman’s ρ values for significant correlations (P < 0.05) are presented as squares in the heat map. The bottom histograms display the distribution of negative (blue) and positive (red) ρ values for matrices based on QMP and RMP.

