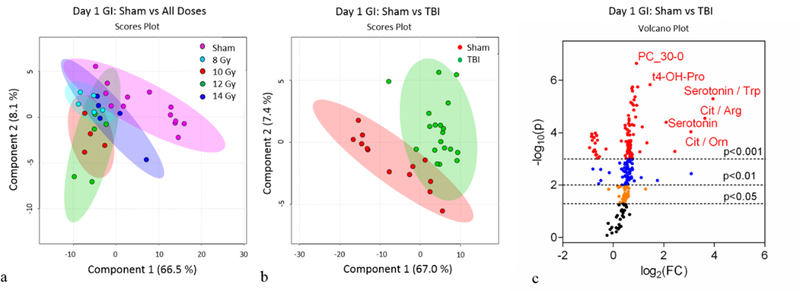
Figure 1.

Day 1 jejunum metabolomics: (a) Partial Least Squares - Discriminant Analysis (PLS-DA) plot comparing sham and individual TBI doses; R2=0.91, Q2=0.54. (b) PLS-DA plot comparing sham and combined TBI doses; R2=0.96, Q2=0.79. For the PLS-DA plots, each point represents a data set from an individual animal. The 95% confidence intervals are indicated by elliptical patterns per group. Data were sum normalized, log transformed, and mean centered. (c) Volcano plot highlighting metabolites that were differentially expressed when comparing sham to TBI.
