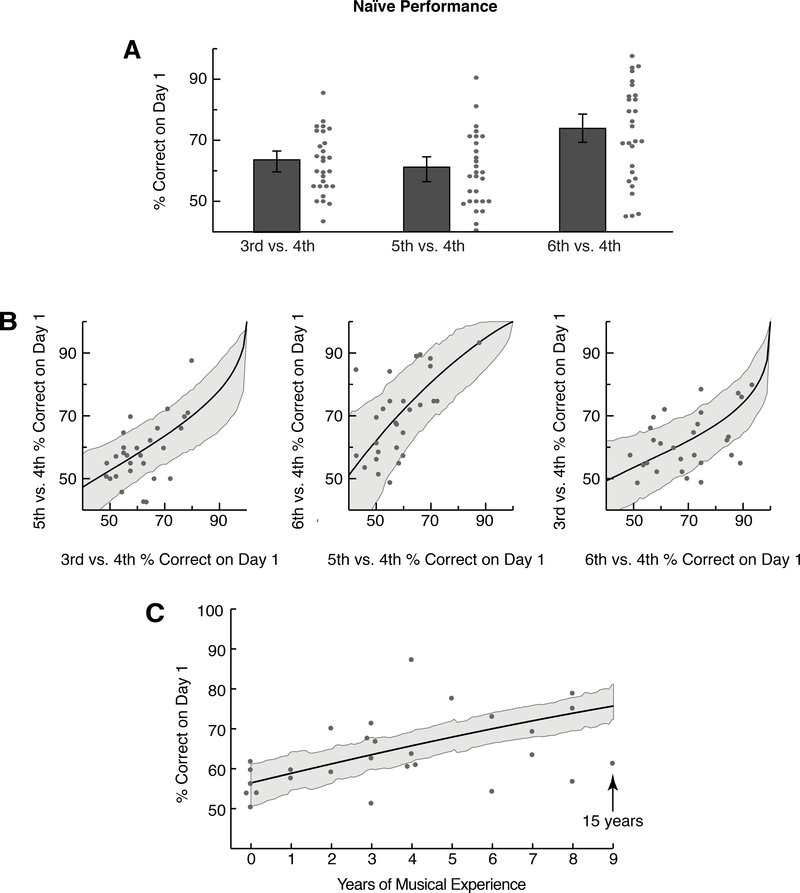
Figure 2.
Naïve performance (day 1). On each trial, listeners were presented a target musical interval (a 4th) and one of three foils (a 3rd, 5th or 6th) and asked to indicate which interval was the target. A. Individual response accuracy on day 1 separated by foil for 28 listeners (gray circles; raw data) with means and standard errors as estimated by a multi-level regression (bars and error bars). B. Individual response accuracy on day 1 (gray circles; raw data) for each of the three foils (x-axes) compared to another of the foils (y-axes) for the three pairwise comparisons (panels), with means and standard errors as estimated by the multi-level regression (lines and gray regions). C. Individual response accuracy on day 1 across years of musical experience (gray circles; raw data) with the mean and standard error of this relationship as estimated by the multi-level regression (line and gray region).

