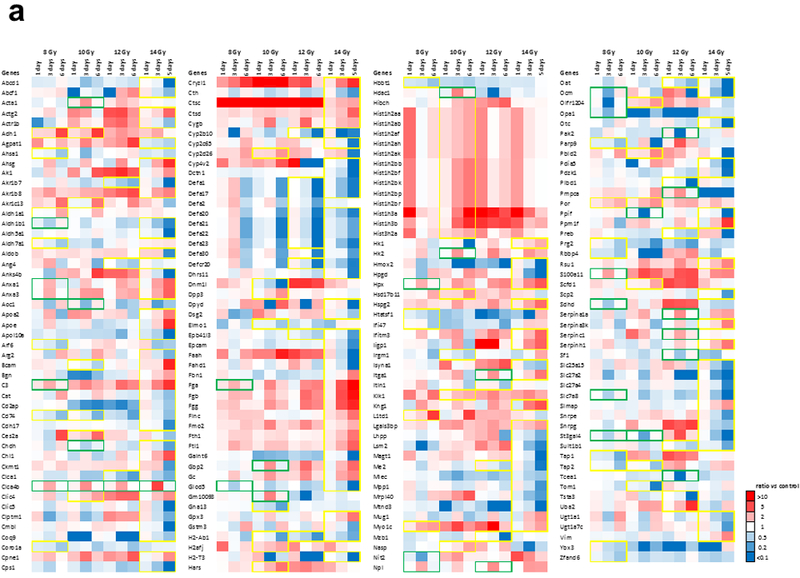
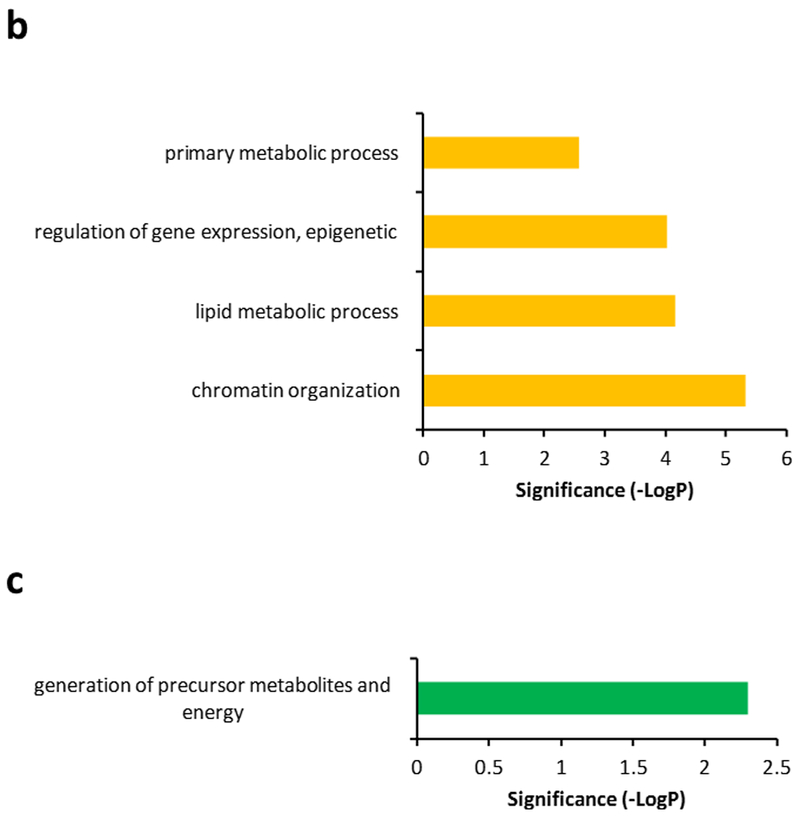
Figure 4. Proteins exhibiting time-dependent changes after irradiation.


(a.) Yellow framed protein expression exhibits a progressive increase or decrease in abundance over time based on linear regression models with R2 > 0.81. Green framed protein expression exhibits a transient but significant increase or decrease (FC > 2, p < 0.05) followed by normalization of protein abundance. (b.) Biological processes associated with progressive changes in proteins over time. Significance was calculated by FDR corrected Fisher’s exact test (p < 0.05). (c.) Biological processes associated with transient changes in proteins that exhibit normalization/recovery. Significance was calculated by FDR corrected Fisher’s exact test (p < 0.05). Protein expression is considered normalization/recovery if difference between day 1 and day 6 is below 30%.
