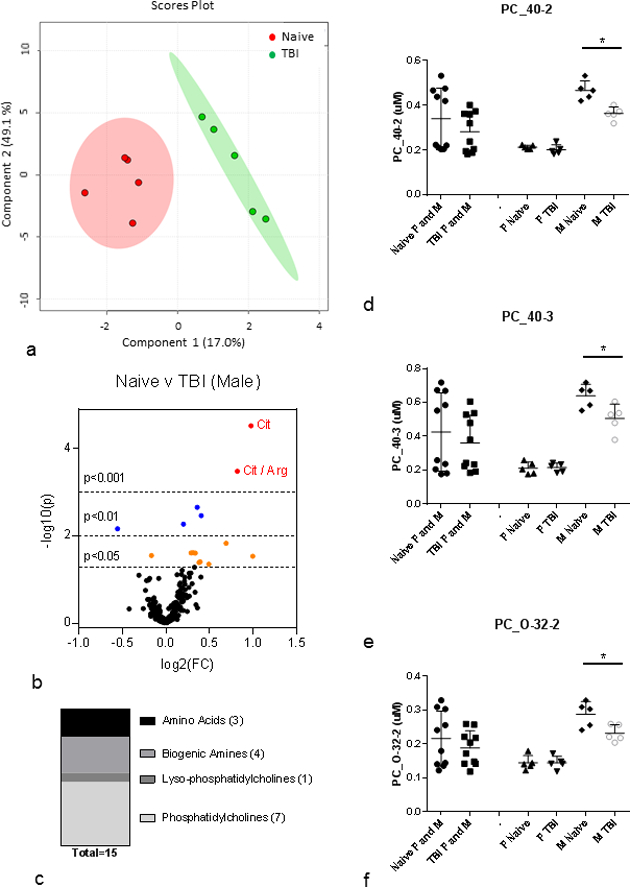
Figure 4. Plasma metabolites changed at 3 days post-8.72 Gy TBI: male single-sex cohort.

(a) PLS-DA plot: naïve (red) v TBI (green); n=5 per group; male only; R2=0.98, Q2=0.65. Each point represents a data set from an individual animal. The 95% confidence intervals are indicated by elliptical patterns per group. Data were sum normalized, log transformed, and mean centered. (b) Volcano Plot: naïve v TBI; n=5 per group; male only. FC=fold change, p=pvalue. Red dots are metabolites with p<0.001, blue dots are metabolites with p<0.01, and orange dots are metabolites with p<0.05, (c) Class distribution of significantly changed metabolites listed in Table 3 (p<0.05). (d-f) PC_42–0, PC_40–3, and PC_O-32–2 as representative metabolites that are significantly changed after IR in only the male cohort. All plasma metabolites assayed from 3 month old C57BL/6 mice; n=10 for each female and male grouped cohort (Naïve, IR) where each n=10 cohort had n=5 each of female and male. Mean ± SD; *p<0.05. M=male, F=female, IR=3 d post-8.72 Gy, naïve = sham.
