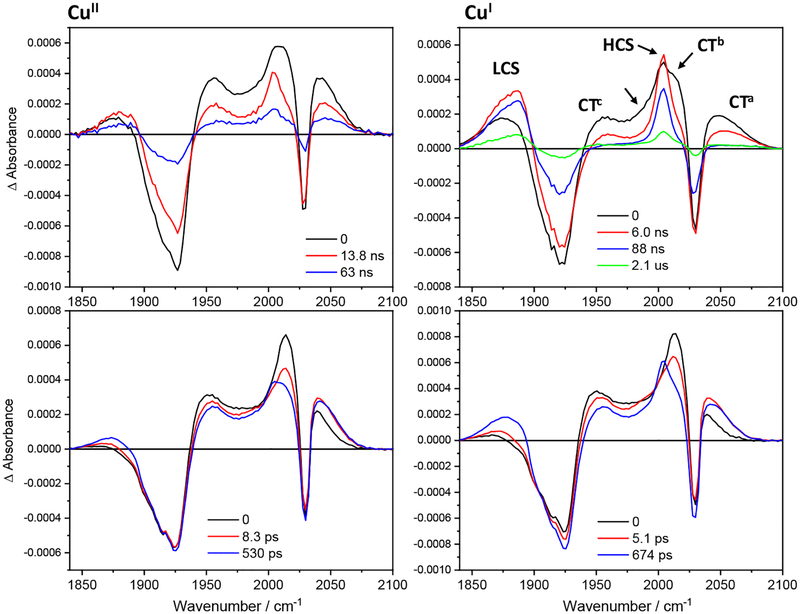
Figure 4.
Evolution associated spectra of Re126FWCuII (left) and Re126FWCuI (right) obtained by global fit of picosecond (bottom) and nanosecond (top) 3D TRIR data (kinetic/spectral) using a sequential multiexponential model. Black curves are spectra are extrapolated to time 0 and correspond to the species formed within the 355, ~0.7 ns laser pulse excitation. Red, blue and green curves correspond to spectra associated with the specified kinetics. The longest-lifetime spectra correspond to the residual species that remains after a process characterized by the specified time constant and decays on a timescale longer than the measurement. Band labelling in the top-right panel is valid for all spectra shown. The unlabeled arrow indicates the ~1985 cm−1 shoulder. Experimental conditions as in Figure 3, except the top-right spectrum (0.63 mM).

