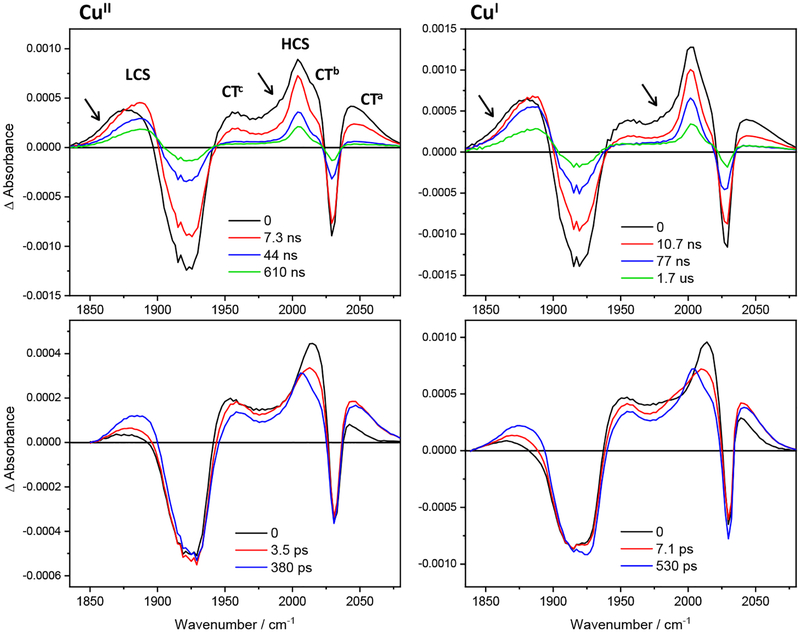
Figure 6.
IR evolution associated spectra (EAS) of Re126WWCuII and Re126WWCuI obtained by global fit of picosecond (bottom) and nanosecond (top) 3D TRIR data (kinetic/spectral) using a sequential multiexponential model. Black curves are spectra are extrapolated to time 0 and correspond to the species formed within the 50 fs (bottom) or 0.7 ns (top) laser pulse excitation. Red, blue and green curves correspond to spectra associated with the specified kinetics. The longest-lifetime spectra correspond to the residual species that remains after a process characterized by the specified time constant and decays on a timescale longer than the measurement (120 μs assumed21 for the top-right spectrum.) Band labelling in the top-left panel is valid for all spectra shown. Arrows indicate the LCS early-time broadening and the ~1985 cm−1 shoulder. Experimental conditions as in Figure S4.

