
Figure 1. Strain diversity across species in early gut metagenomes.
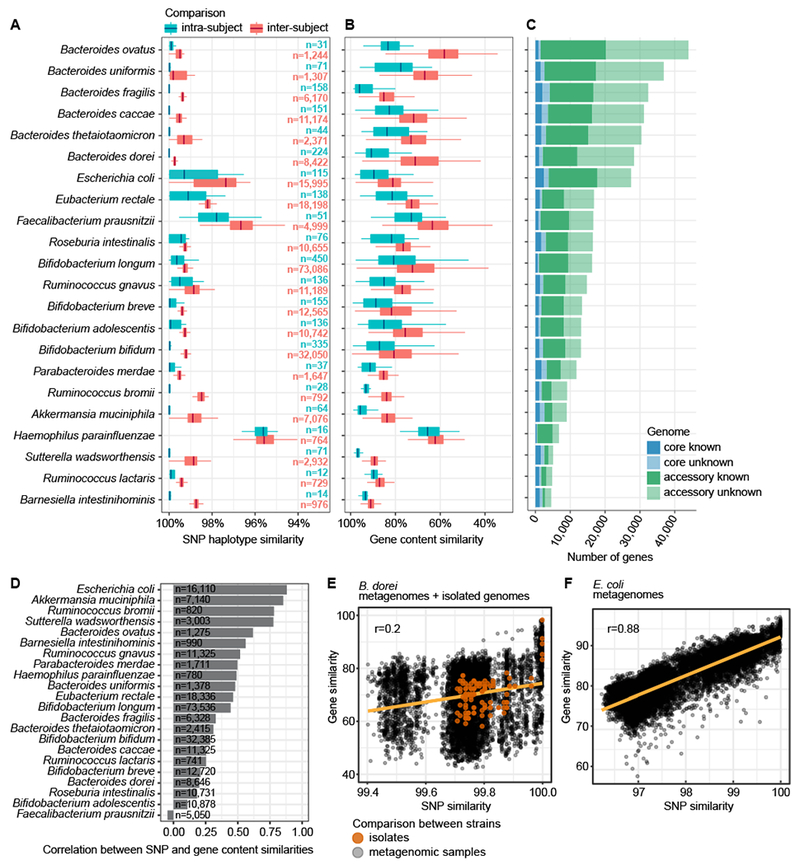
A SNP haplotype similarities per species based on all pairwise comparisons (dominant strain per species per sample) and stratified to intra-subject and inter-subject comparisons. Species containing >10 comparisons in both strata are shown. B Gene content similarities (the percentage of shared genes in the smallest of the two genomes) per species, evaluated on pangenomes generated by metagenomic assembly. Boxplots as in panel A. The box (A, B) shows the interquartile range (IQR), the vertical line shows the median and the whiskers show the range of the data (up to 1.5 times IQR). Sample size (n) per boxplot in panel A gives number of comparisons per panels A and B. C The size of core and accessory genomes per species stratified by the functional annotation of genes using eggNOG. Panels A-C are ordered according to the size of the metagenomic pangenome. D Pearson’s correlation coefficients between SNP- and gene content-based similarity measures between strains. Sample size (n) is indicated. E B. dorei strains’ SNP and gene content similarities show low Pearson’s correlation (r=0.2, n=8646 comparisons from metagenomes, n=136 comparisons of isolate genomes). Comparisons between isolate genomes are shown in orange for reference. F E. coli strains’ SNP and gene content similarities (Pearson’s r=0.88, n=16,110 comparisons).