Figure 5.

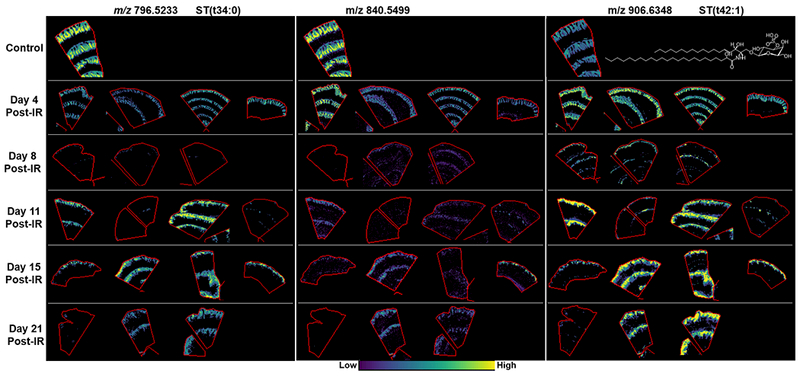
MALDI-MS images of glycophosphingolipids mapped to the villi epithelium in control and days 4, 8, 11, 15 and 21 post-irradiation. Example lipid structures are given where possible.

MALDI-MS images of glycophosphingolipids mapped to the villi epithelium in control and days 4, 8, 11, 15 and 21 post-irradiation. Example lipid structures are given where possible.