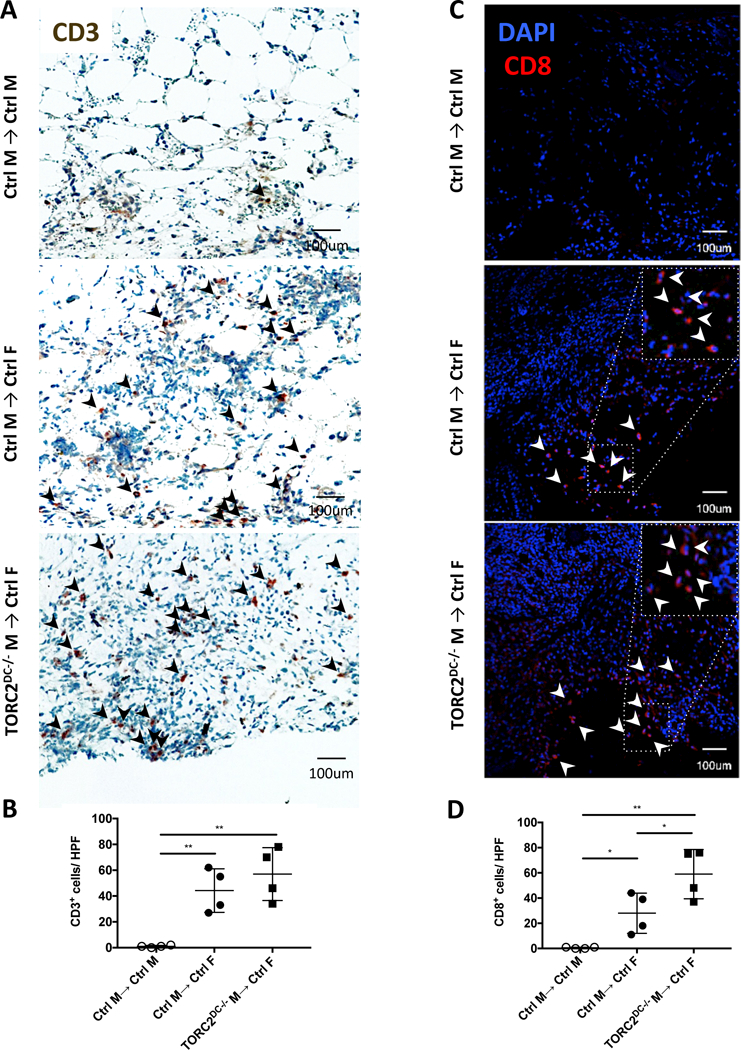
FIGURE 2.

HY-mismatched skin grafts from TORC2DC−/− donors elicit enhanced CD8+ T cell infiltration. Quantitative analysis of T cell infiltration in skin grafts from WT control (Ctrl) M and TORC2DC−/− M donors was performed on post-operative day (POD) 7. (A) Representative immunohistochemical staining for CD3+ cells (arrowheads); n=4 mice per group. (B) Numbers of CD3+ cells per high power field (hpf) in skin grafts; n=4 mice per group; one-way ANOVA Tukey’s multiple comparisons test, **, p<0.01. (C) Representative staining for CD8+ cells (arrowheads); n=4 mice per group. (D) Numbers of CD8+ cells per hpf in skin grafts; n=4 mice per group; one-way ANOVA Tukey’s multiple comparisons test, *, p < 0.05; **, p<0.01.
