
Figure 2.
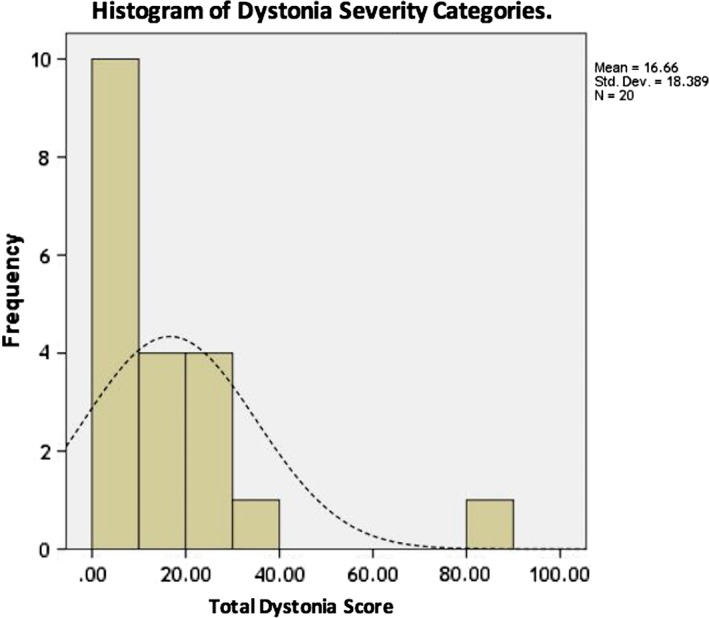
Histogram of Dystonia Severity scores categories.
The horizontal line shows the total dystonia rating score, none (0); mild (>0 ≤ 20); mild to moderate (>20 ≤ 40); moderate (>40 ≤ 70) and severe (>70 ≤ 100), while the vertical line represents the number of patients in each category. The dotted line represents the normal distribution curve.