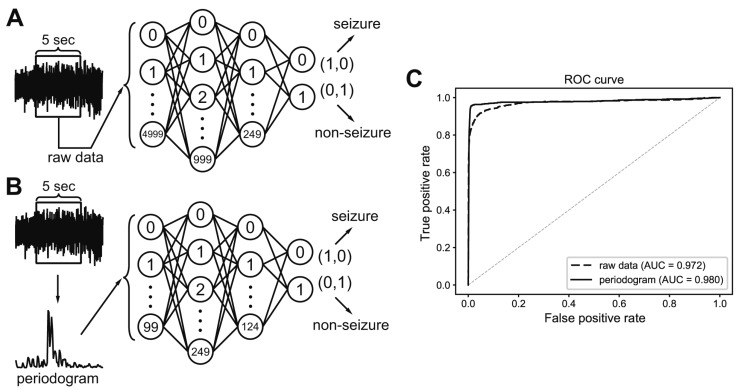
Fig. 3. Classification process for 5-sec electroencephalogram (EEG) segments that were either raw or subjected to spectral analysis.
(A) A classifier was built to distinguish total 5,000 raw EEG inputs from 5-sec EEG segments. (B) A classifier was built to distinguish total 100 periodogram results between 0 to 99 Hz. (C) Receiver operating characteristics (ROC) curve of classifiers that learned to distinguish seizure events from either raw data or periodogram results. Area under the curve (AUC) was calculated for each classifier.

