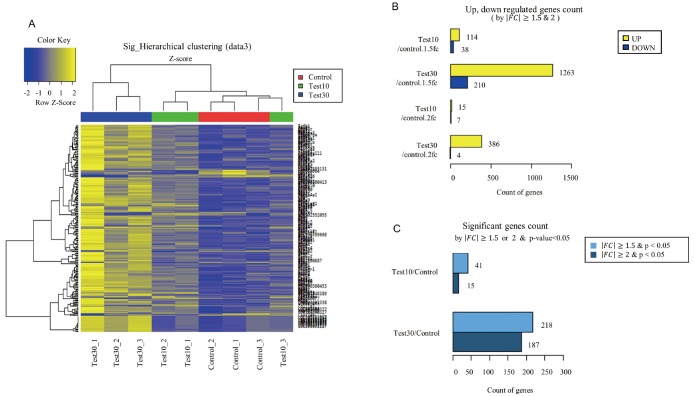
Fig. 1. Microarray analysis of messenger RNA expression in bio-active materials-coated fabric and control rat.
(A) Hierarchical clustering heatmap was classified as color based on differentially expressed genes between Test10 group (10% materials-coated fabric), Test30 groups (30% materials-coated fabric) and control group. Yellow and blue color represents higher and lower than z-score mean. (B) Up- and down-regulated genes count were indicated each group (fold change [FC] > 1.5 and 2). (C) Significant genes count was indicated each group (FC < 1.5 and < 2, p < 0.05).

