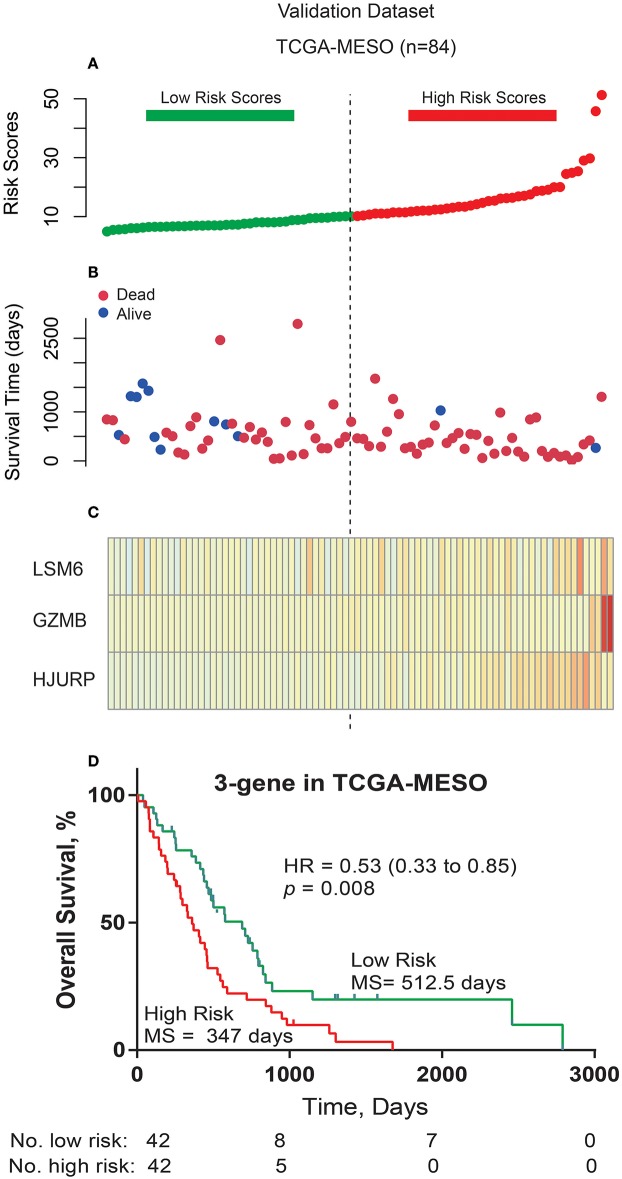
Figure 3.
Three-gene prognostic signature biomarker performance in the validation cohort. (A) The risk scores for all patients in the TCGA cohort are plotted in ascending order and marked as low risk (bottle green) or high risk (red), as distinguished by the threshold (vertical imaginary line). (B) Survival status for the three prognostic genes in the TCGA cohort. Dark red indicates dead, and Dodger blue indicates alive. (C) Heatmap of the three prognostic genes in the TCGA cohort that were differentially expressed between the high- and low-risk groups. Dark red indicates higher expression, and light yellow indicates lower expression. (D) Kaplan-Meier estimates for the overall survival of patients in the TCGA cohort stratified by the three-gene prognostic signature into high and low risk with the log-rank hazard ratio (HR), 95% confidence interval (CI), P-value, and median survival (days).

