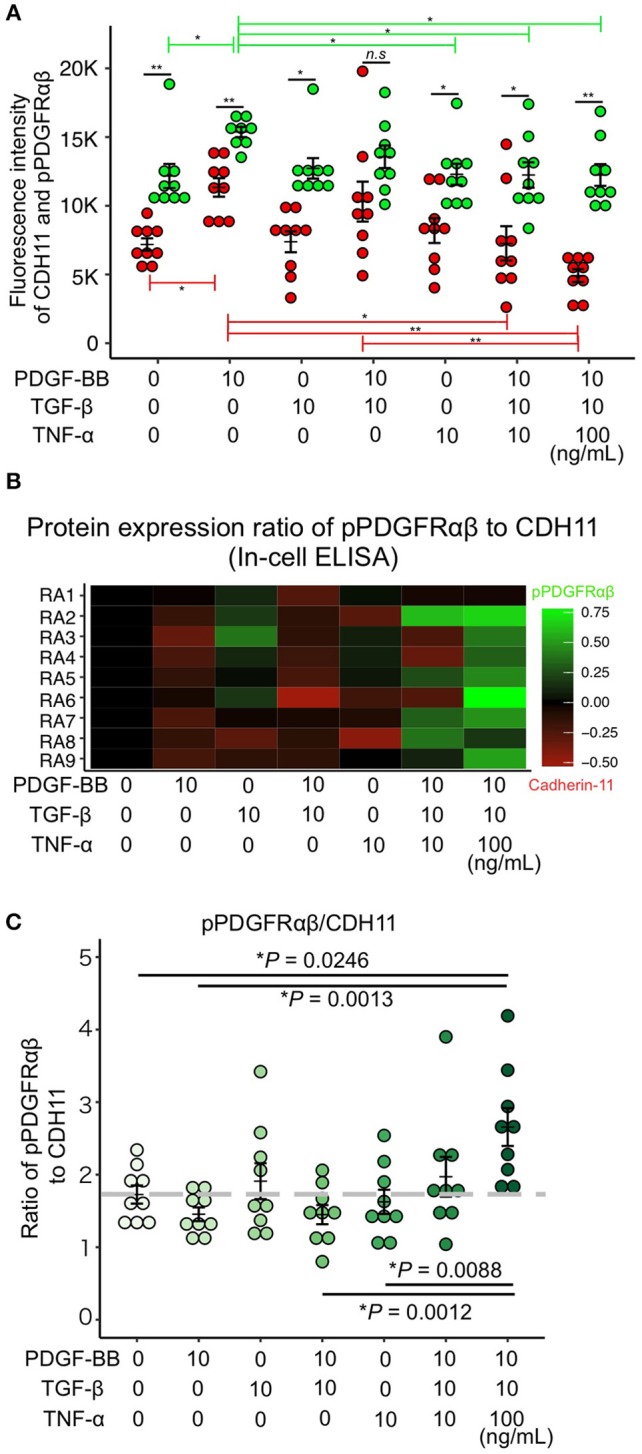
Figure 5.

PDGF-BB, TGF-β, and TNF-α stimulation of RA-FLS resulted in predominant pPDGFRαβ expression. (A–C) quantitative data for pPDGFRαβ and CDH11 expression obtained by performing in-cell ELISAs. Stimulation with TNF in addition to 2GF reduced CDH11 expression, but not pPDGFRαβ expression. Stimulation with 2GF reduced the pPDGFRαβ/CDH11 ratio and elevated CDH11 expression. Stimulation with 2GF + TNF caused concentration-dependent increases in the pPDGFRαβ/CDH11 ratio and elevated pPDGFRαβ expression. One-way ANOVA was used for statistical analysis, and the Tukey–Kramer method was used to compare the groups. The significance level was P < 0.05. *P < 0.05; **P < 0.01.
