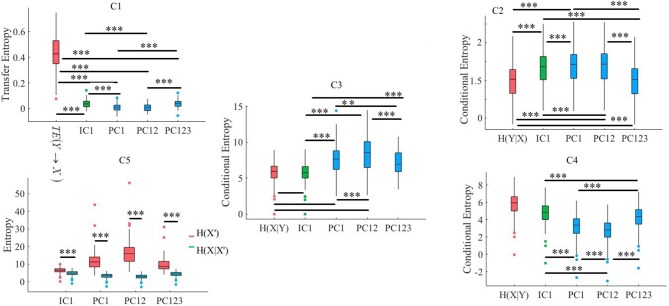
Figure 6.
VFT. C1: Criterion 2.1: TE(Y → X′) ≤ TE(Y → X), C2: Criterion 2.2: H(Y|X) ≤ H(Y|X′), C3: Criterion 2.3: H(X|Y) ≤ H(X′|Y), C4: Criterion 2.4: H(X|X′) ≤ H(X|Y), C5: Criterion 2.5: H(X|X′) ≤ H(X′). In these subplots, IC1, PC1, PC12, and PC123 refer to the measured quantity by these components after their respective SBF attenuation algorithms. Asterisks mark the components with significant difference (*p < 0.05, **p < 0.01, ***p < 0.001).

