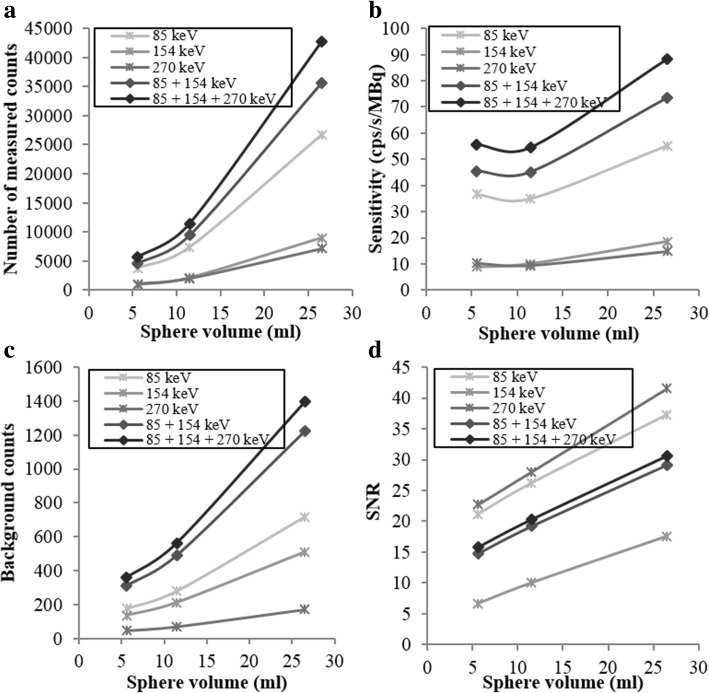
Fig. 3.
(a) Number of measured counts in the hot spheres, (b) sensitivity, (c) number of counts measured in the background and (d) signal-to-noise ratio versus the sphere volume of the NEMA phantom. In each panel, we employed a 30 s/projection acquisition duration, and we also inspected the impact of using images obtained using single energy windows and images obtained by adding the images of different energy windows

