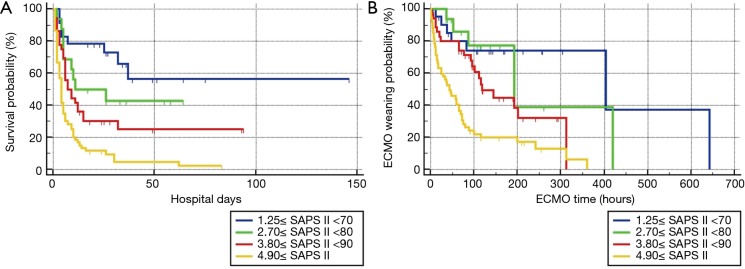
Figure 2.
Kaplan-Meier curves for the cumulative survival probability of SAPS II and the cumulative ECMO weaning probability of SAPS II. Patients were divided into 4 groups according to SAPS II: those with SAPS II <70 (n=23), those with 70≤ SAPS II <80 (n=16), those with 80≤ SAPS II <90 (n=36), and those with SAPS II ≥90 (n=60). (A) Comparison of survival curves with the log-rank test: Chi-square test χ2=40.4608, df =3, P<0.001. Overall mean survival rate was 25.9%, 6-day survival rate was 50%, 10-day survival rate was 40.7%, and 30-day survival rate was 27.3%. (B) Comparison of weaning probability curves with log-rank test: Chi-squared test χ2=34.1365, df =3, P<0.001. Comparison of weaning probability curves with the log-rank test: Chi-square test χ2=5.9915, df =3, P=0.1120. Overall mean ECMO weaning rate was 39.20%, 8-day mean ECMO weaning rate was 50%, 10-day mean ECMO weaning rate was 45.8%, and 30-day mean ECMO weaning rate was 37.4%.

