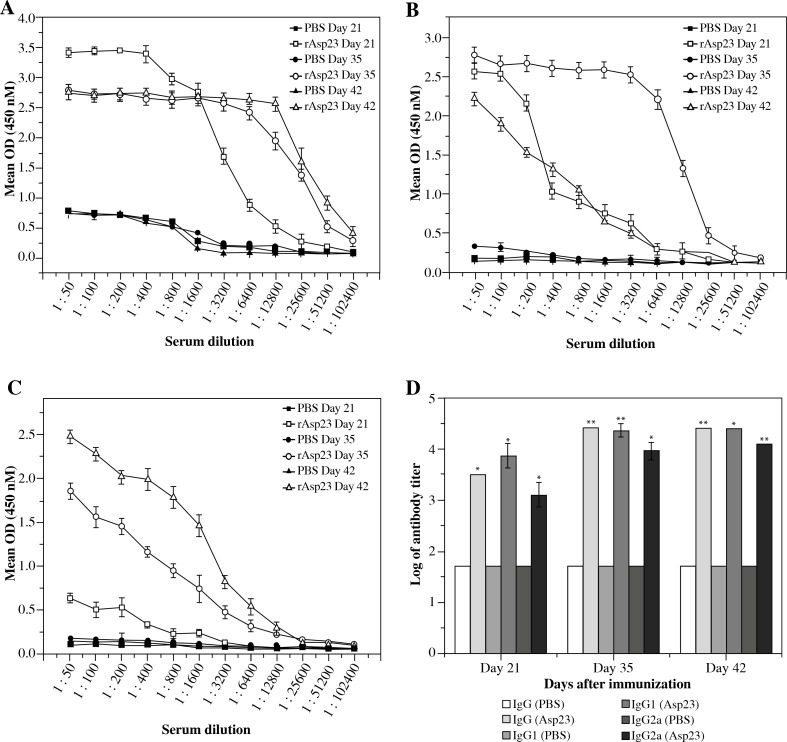
Fig. 2.
Antibody responses induced by rAsp23. The antibody responses induced by rAsp23 in BALB/c mice were determined using indirect ELISA. A) Levels of IgG on days 21, 35 and 42 in mice inoculated with rAsp23 and PBS. B) Levels of IgG1. C) Levels IgG2a (D) Log titers of IgG, IgG1 and IgG2a in test and control groups#. The error bars in each case were generated from 6 mice; asterisks represent statistical significance of differences in antibody responses of test mice compared to control mice (*p < 0.01, **p < 0.001)
#Antibody titers were calculated as the reciprocal of the highest serum dilution that gives an OD value greater than the cutoff OD. The cutoff OD at 450 nM was calculated as the mean of control (mice injected with PBS) values + 3 × standard deviation of the control values

