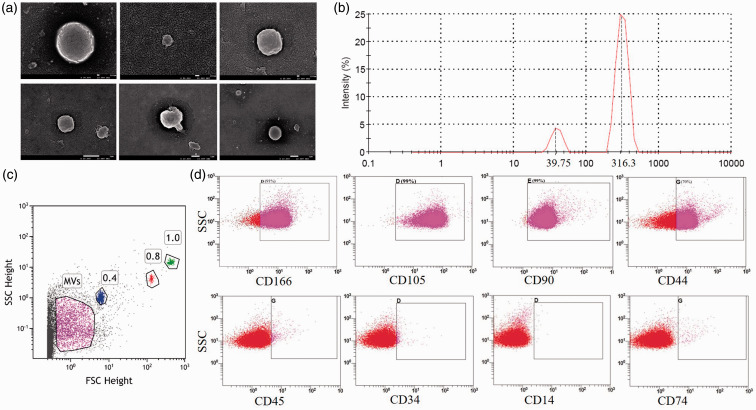
Figure 1.
Characteristics of MSC–MVs. (a) Image of MSC–MVs scanning by electron microscopy (scale: upper 100 nm, lower 1 μm). (b) Cumulative distribution graph of MSC–MVs. (c) Microspheres distinguished the MV particle size (using 1.0 μm, 0.8 μm, and 0.4 μm standard microspheres). (d) Immunophenotypic identification of MSC–MVs (upper: MSC–MVs, lower: isotype). (A color version of this figure is available in the online journal.)

