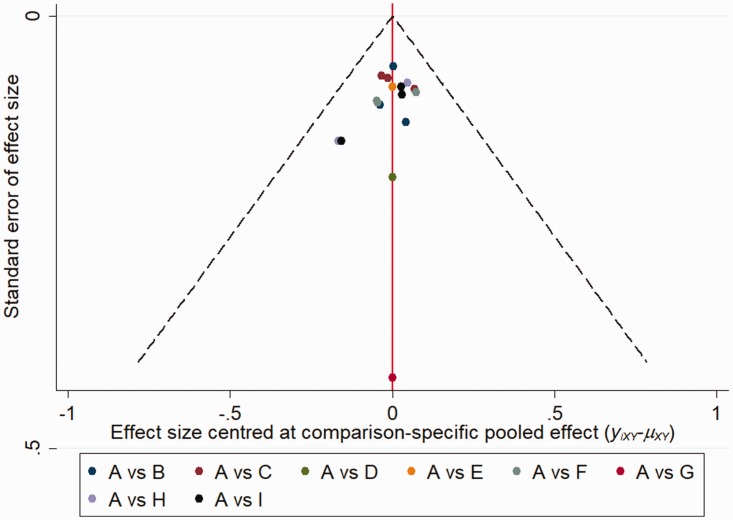
Figure 5.
Comparison-adjusted funnel plot for the network meta-analysis. The red line suggests the null hypothesis that the study-specific effect sizes do not differ from the respective comparison-specific pooled effect estimates. Different colors represent different comparisons. (A: Non-steroidal anti-inflammatory drugs [NSAIDs]; B: Traditional acupuncture; C: Eye acupuncture; D: Wrist–ankle acupuncture; E: Superficial acupuncture; F: Moxibustion; G: Electroacupuncture; H: Ear acupuncture; I: Abdominal acupuncture).

