Figure 2.

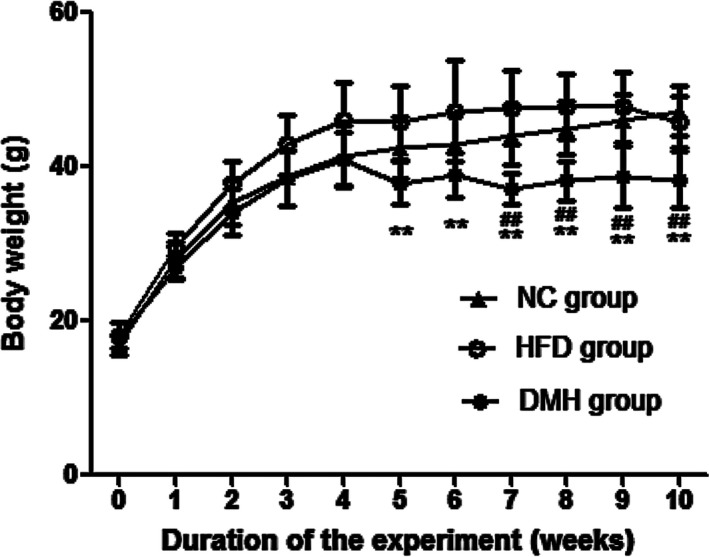
Changes in body weight during the experiment. DMH, diabetic myocardial hypertrophy model; HFD, high‐fat diet control; NC, normal control. Mean ± SD, nNC = 15, nHFD = 15, nDMH = 12. ## P < 0.01 vs NC group; **P < 0.01 vs HFD group

Changes in body weight during the experiment. DMH, diabetic myocardial hypertrophy model; HFD, high‐fat diet control; NC, normal control. Mean ± SD, nNC = 15, nHFD = 15, nDMH = 12. ## P < 0.01 vs NC group; **P < 0.01 vs HFD group