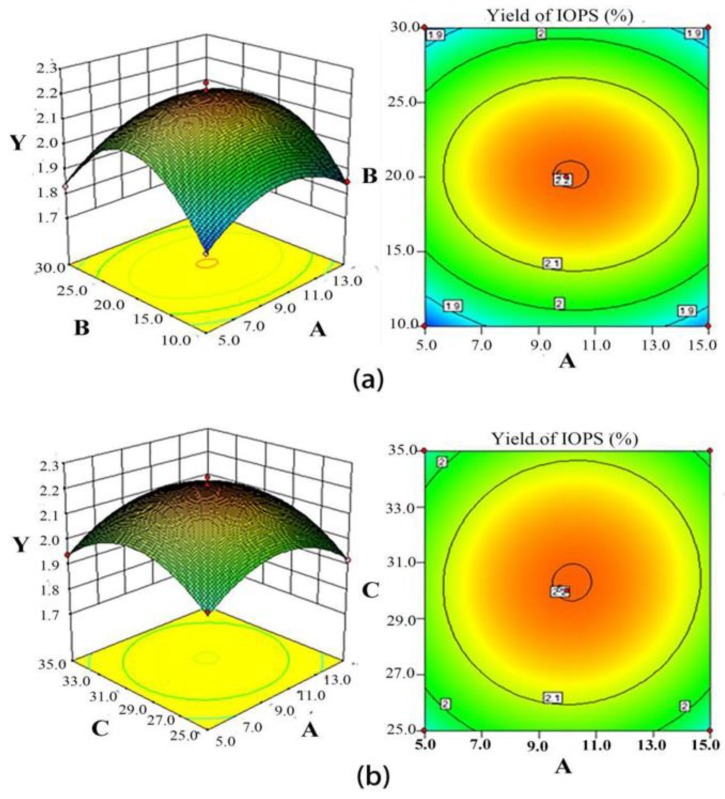
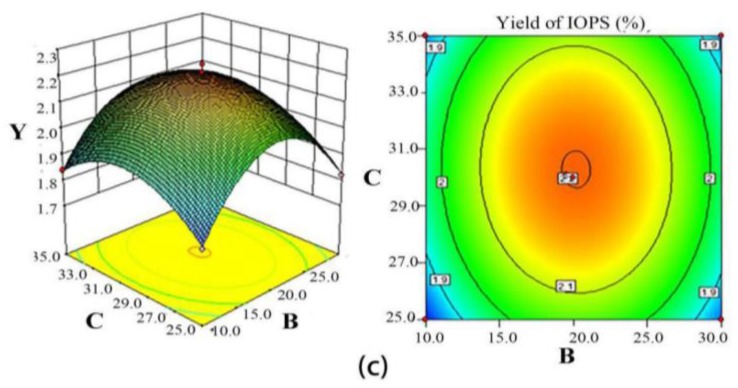
Figure 3.
Response surface and contour plots showing (a) the effects of mass fraction of (NH4)2SO4 (A, %) and amount of t-butanol (B, mL) on the EY of IOPS (Y, %); (b) the effects of mass fraction of (NH4)2SO4 (A, %) and temperature (C, °C) on the EY of IOPS (Y, %); and (c) the effects of the amount of t-butanol (B, mL) and temperature (C, °C) on the EY of IOPS (Y, %).


