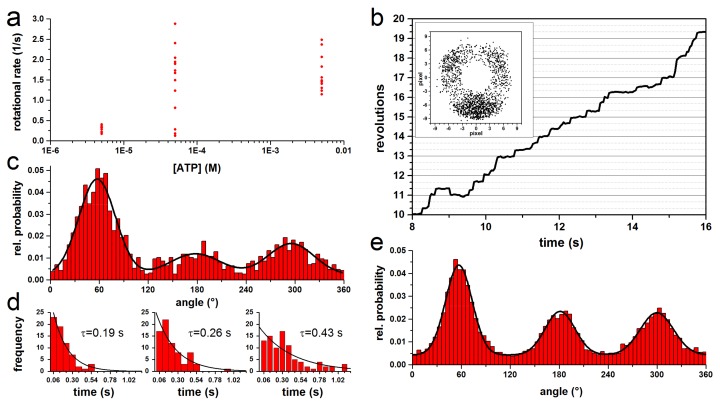
Figure 3.
Properties of rotating actin filament-EcFOF1 complexes during ATP hydrolysis. (a) Rotational rate versus ATP. For short actin filaments (≤1 µm), the rotational rate is independent of the ATP concentration and the filament length. (b) Trajectory of a typical rotating complex at 100 µM ATP in steps of 120°. The inset shows the endpoints of the 0.8 µm actin filament. (c) Normalized histogram of the angular probability distribution of the complex in b, where the three peaks, separated by 120°, were fitted with a Gaussian. (d) Dwell time histograms of each peak in c fitted with monoexponential decay. The dwell times (τ) are given for each histogram. (e) Combined normalized histogram of the angular distribution of rotating actin filament from 13 single molecules at 50–5000 µM ATP with 513 to 2174 frames per molecule. Each dataset was fitted with three Gaussians to determine the area of each peak. The datasets were aligned by positioning the largest peak at 60°.

