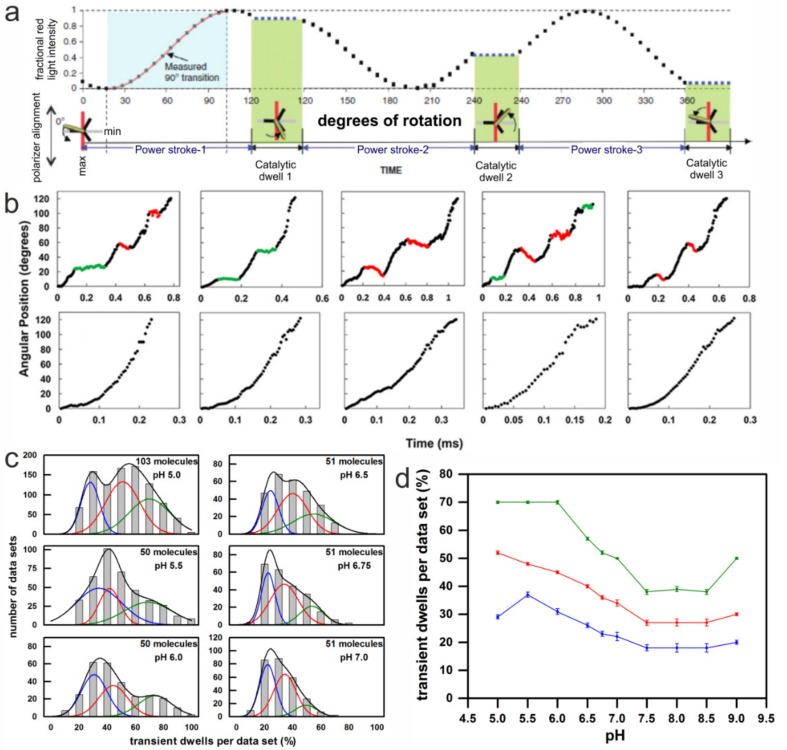
Figure 5.
Method and results of single-molecule rotation experiments with AuNR attached to the c-ring of immobilized EcFOF1 during ATP hydrolysis. (a) Theoretical plot of the intensity of scattered red light from a nanorod during one complete revolution that involves three consecutive power strokes and three consecutive catalytic dwells separated by exactly 120°. The nanorod is initially positioned almost—but not exactly—perpendicular to the orientation of the polarizer, such that the scattered light intensity goes through a minimum then a maximum prior to catalytic dwell 1. A transition includes the data between the minimum and maximum intensities representing 90° of the 120° of rotation. For analysis transitions from power stroke-1 to dwell 1 were selected. (Modified from [56]) (b) Examples of time-dependent changes in rotational position of n-EcFOF1 during F1-ATPase–dependent power strokes at pH 5.0, where transient dwells, either present (top) or absent (bottom), are shown. Transient dwells where rotation was halted or contained CW rotation are colored green and red, respectively. (c) The distribution of single-molecule n-EcFOF1 power stroke data sets as a function of the percentage of the occurrence of transient dwells per data set, which were binned to each 10% (gray bar graphs). Each data set contained ~300 power strokes, derived from the indicated number of molecules. The data were fitted to the sum of three Gaussians (black line), where the probability of forming transient dwells was low (blue line), medium (red line), and high (green line). (d) The pH dependencies of the average percent of transient dwells per data set, with standard errors derived from the three Gaussians. (Modified from [108]).

