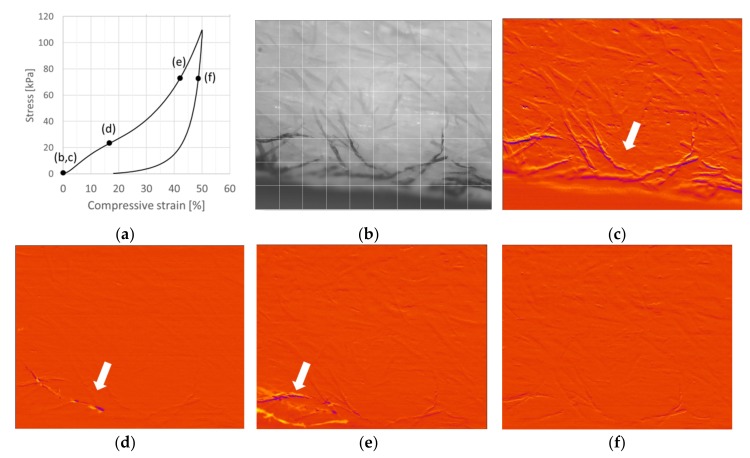
Figure 6.
Compression test of a CTMP sample (SDS surfactant, 2% consistency, density 71.9 kg/m3). (a) Stress–strain curve for a 50% compression cycle. (b) Image of the network at 0% compression. Correlation plots showing fibers dislocating from previous locations (shown in yellow color) to new adjacent locations (shown in dark purple color). (c) Activity of the network at 0% compression (under a load of 250 Pa) Abrupt (within 100 ms) dislocations of a fiber (d) at 17.8% and (e) again in the same region at 43.9% compression. (f) The network during load removal at 43.9%. The grid size is 0.67 mm × 0.67 mm with similar in-depth focus length. Imaging frequency is 10 Hz.

