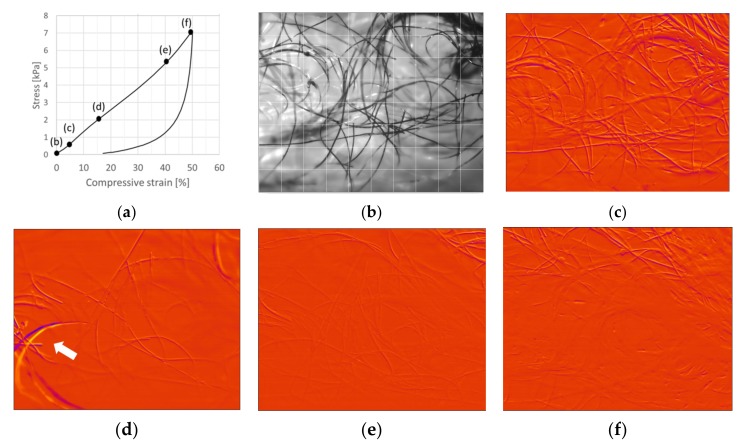
Figure 8.
Compression test of the viscose sample V6. (a) Stress–strain curve for a 50% compression cycle. (b) Image of the network at 0% compression. Correlation plots showing dislocations of fibers from previous locations (shown in yellow color) to new adjacent locations (shown in dark purple color). (c) Dislocation activity in the network at low 5.6% compression. (d) Abrupt strong fiber dislocation at 17.9% compression; (e) The almost-still network at 41.8% compression. An almost identical correlation plot was also observed at 41.8% in release. (f) Dislocations concentrating on the upper region of the image at 49.6% compression. Imaging frequency: 10 Hz.

