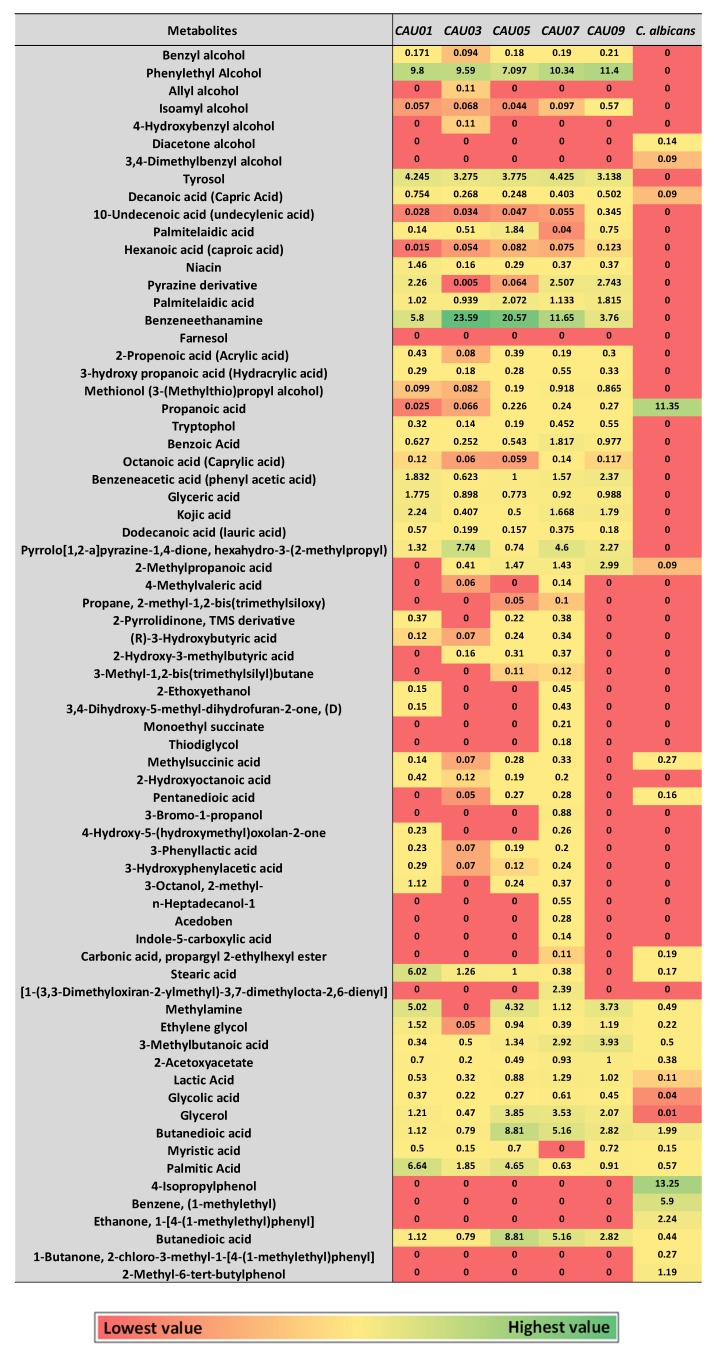
Figure 3.
Heatmap of major identified metabolites in Candida cultures by GC-MS. Metabolite average relative percentage of four experimental replicates from two independent biological experiments were displayed as colors ranging from red to green as shown in the key. The relative percentage of a metabolite represented in relation to total areas of all detected metabolites in an extract.

