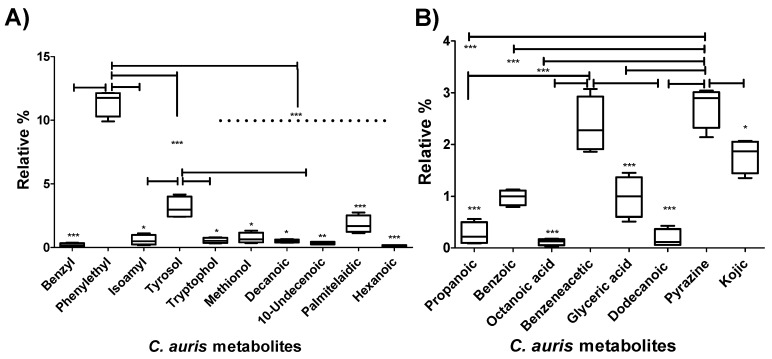
Figure 4.
Relative percentages of metabolites produced by C. auris CAU09 cultures. (A) The metabolites produced by the organism for the purpose of its morphogenic changes. (B) The metabolites produced by the organism for the purpose of protection and colonization. The quantity of each metabolite was represented as the relative percentage by measuring the area under the peak of each metabolite in relation to the total areas of all other metabolites detected in the extract. The data display the mean of the relative percentage ± standard error of the mean. The data was graphed using Box-and-Whiskers Plots and analyzed by one-way analysis of variance (ANOVA) using Bonferroni’s Multiple Comparison Test. P value < 0.05 was considered as significant. The standard error represents the mean of 4 replicas of two independent experiments. The level of significance was indicated by asterisks.

