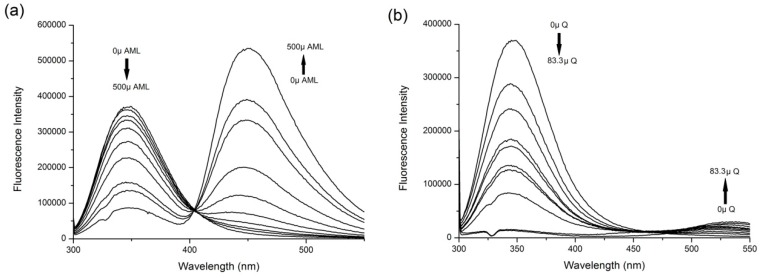
Figure 2.
The fluorescence emission spectra of (a) amlodipine besylate (AML) + human serum albumin (HSA) and (b) Q + HSA systems at excitation λ = 295 nm. Conditions: T = 310.15 K, pH = 7.4. The HSA concentration was 5 μM; AML concentrations were 0, 3.9, 7.8, 15.6, 31.25, 62.5, 125, 250, 333.3, and 500 μM; Q concentrations were 0, 1.95, 3.9, 7.8, 10.4, 15.6, 20.8, 31.25, 41.6, 62.5 and 83.3 μM.

