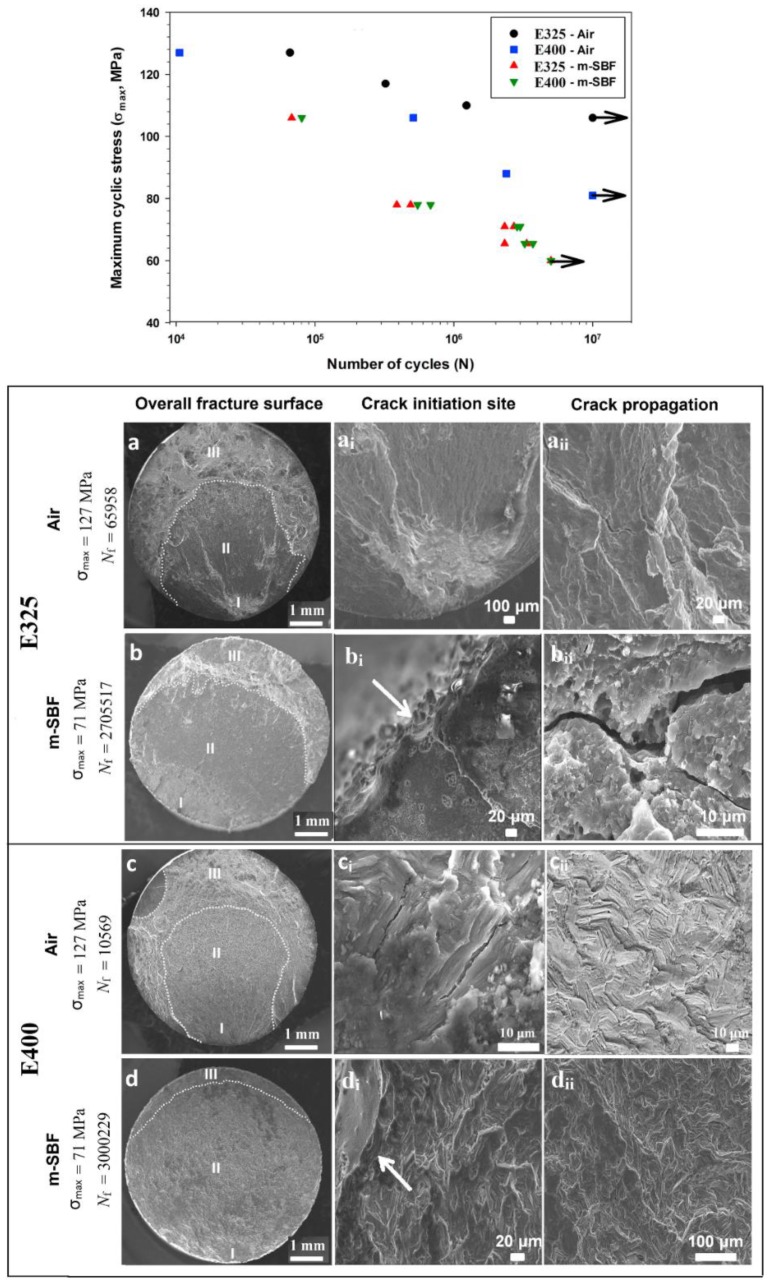
Figure 28.
Top: S-N fatigue curves for E325 and E400 Mg alloys tested in air and m-SBF. Arrows correspond to run-out samples. Bottom: SEM fractographs: (a) E325 tested in air, (b) E325 tested in m-SBF, (c) E400 tested in air, (d) E400 tested in m-SBF. σmax is the maximum applied stress amplitude and Nf is the number of cycles to failure. The arrows in bi and di indicate locations of crack nucleation [324]. Reprinted with permission from Elsevier.

