
Figure 1. 10x Genomics Profiling of Unselected Adult Mouse and Human Spermatogenic Cells Reveals the Extent of Gene Expression Heterogeneity during Steady-State Spermatogenesis.
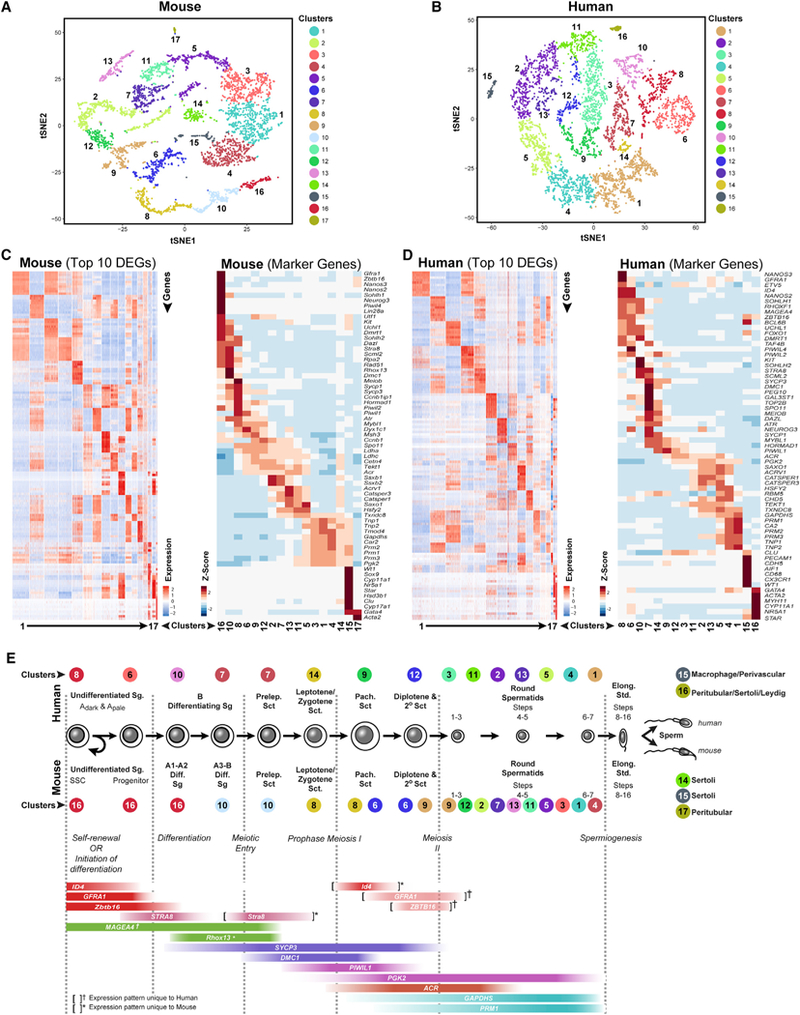
(A and B) tSNE plots show 10x Genomics profiling of unselected spermatogenic cells from (A) mouse testes and (B) human testes. Unbiased cell clusters are distinguished by color according to the key.
(C and D) Heatmaps show the top 10significantly differentially expressed genes (DEGs) between each cell cluster (left) and expression of key cell-type-specific markers (right) for (C) mouse and (D) human spermatogenic cells. Gene lists can be found in Table S1.
(E) Identification of cell clusters expressing the noted marker genes allowed clusters to be aligned with specific spermatogenic cell types (*mouse- or †human-specific expression patterns).