
Figure 2. Adult Spermatogonia Are Heterogeneous in Mice and Men.
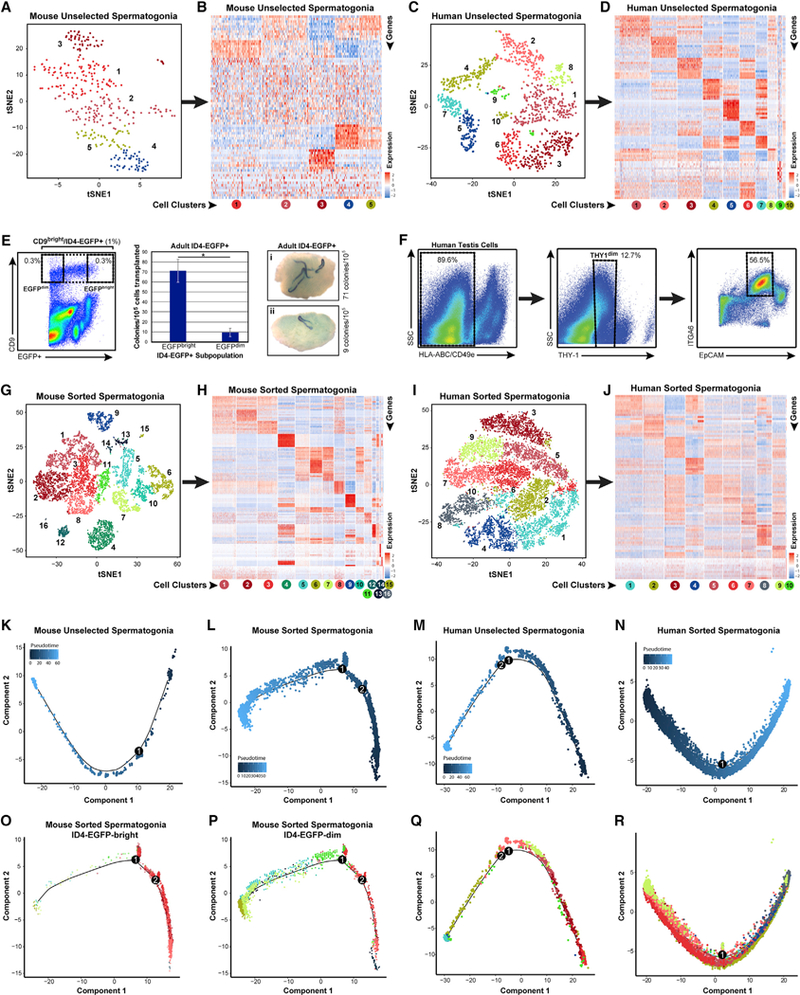
(A and C) Clusters of steady-state spermatogenic cells (Figures 1A and 1B) containing spermatogonia (mouse clusters 10and 16; human clusters 6,7, 8, and 10) were isolated and re-analyzed. tSNE plots show unbiased re-clustering of unselected spermatogonia from (A) mouse or (C) human testes (colors distinguish clusters).
(B and D) Heatmaps show the top 10 significantly differentially expressed genes (DEGs) between each cell cluster for (B) mouse and (D) human unselected spermatogonia (circles below heatmaps are colored and numbered by tSNE cluster). Gene lists can be found in Table S1.
(E and F) We also profiled sorted spermatogonia from (E) adult Id4-Egfp mouse testes (CD9bright/EGFP+, 1% of unsorted, and CD9bright/EGFPbright or CD9bright/EGFPdim subpopulations, each 0.3% of unsorted) and (F) adult human testes (HLA-ABCnegative, CD49enegative, THY1dim, ITGA6+, and EpCAMdim; ~6.4% of unsorted). Transplant of adult mouse EGFPbright/CD9bright versus EGFPdim/CD9bright spermatogonia shows 7.5-fold greater colonization activity of EGFPbright versus EGFPdim cells (*Student’s t test p < 0.02), demonstrating functional SSC enrichment and depletion, respectively.
(G and I) Additional tSNE plots show unbiased clustering of sorted adult spermatogonia from (G) mouse and (I) human testes (colors distinguish clusters).
(H and J) Heatmaps show the top 10 significantly DEGs between each cell cluster for sorted (H) mouse and (J) human spermatogonia.
(K-R) Pseudotime trajectories of (K-N) unselected and sorted spermatogonia in which cells are ordered from beginning (darkest blue color) to end (lightest blue) according tothe legend or (M), (N), (P), and (R), in which cells are colored asthey appear by cluster in the corresponding tSNE plots. Branch points in the singlecell trajectories are noted by black numbered circles. Spermatogonial clusters included in this trajectory analysis included (K) mouse unselected spermato- gonia—all clusters; (L, O, and P) mouse sorted spermatogonia—clusters 1–3, 5–8,10,11,13, and 14; (M and Q) human unselected spermatogonia—all clusters; and (N and R) human sorted spermatogonia—all clusters.
(L, O, and P) For mouse sorted spermatogonia (L) that were analyzed and displayed in pseudotime together, we also retrospectively displayed the two input subpopulations separately from the same pseudotime trajectory in (O) ID4-EGFPbright spermatogonia and (P) ID4-EGFPdim spermatogonia.