
Figure 3. Single-Cell Spermatogonial Trajectories Reveal Biological Transitions Coinciding with SSC Self-Renewal and Initiation of Differentiation in Pseudotime.
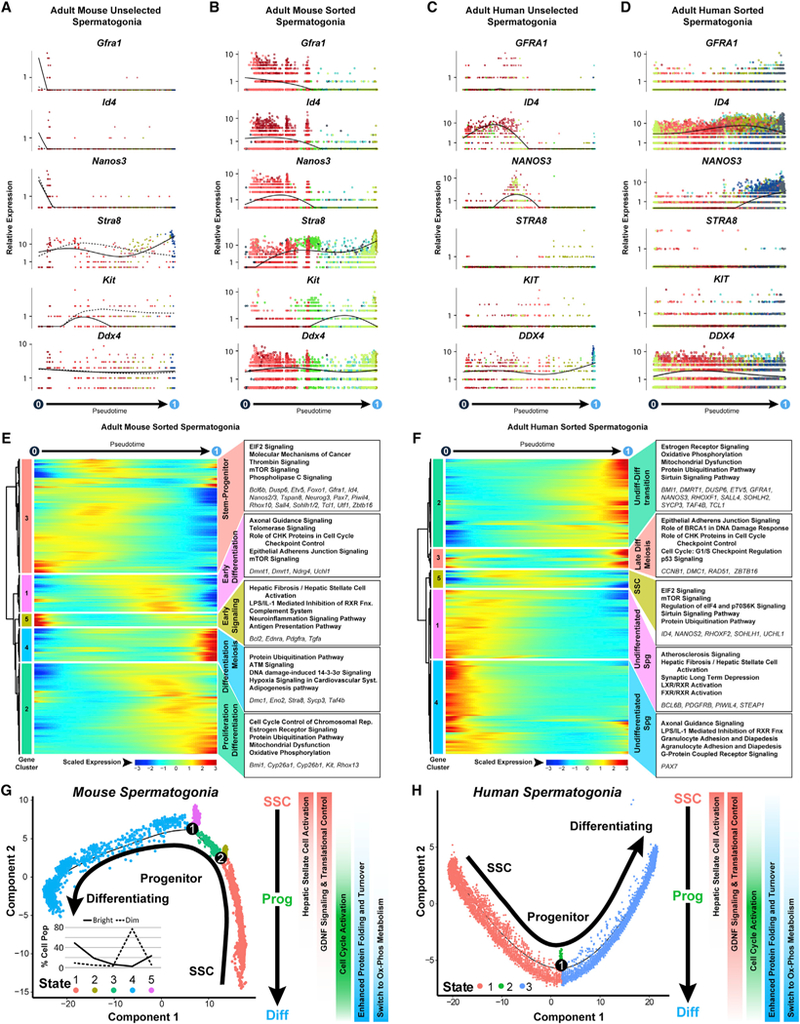
(A-D) Expression patterns of key landmark genes over pseudotime among (A) adult mouse unselected spermatogonia, (B) adult mouse sorted spermatogonia.
(C) adult human unselected spermatogonia, and (D) adult human sorted spermatogonia. Cells are colored according to the cluster colors in the corresponding tSNE plots(Figures 2A, 2C, 2G, and 2I) and ordered according tothe pseudotime plots (Figures 2K-2N). Pseudotime(scaled,0to 1)is indicated beloweach gene plot column.
(E and F) Clusters of genes that were differentially expressed across pseudotime from (E) adult mouse sorted spermatogonial and (F) adult human sorted spermatogonial datasets are shown as heatmaps according to expression color code noted at the bottom (see Table S2). Dendrograms show hierarchical relationship between gene clusters. The top five over-represented biological pathways from Ingenuity Pathway Analysis of each cluster are noted at the right in bold (see Table S3), and key genes are italicized.
(G and H) Trajectories (identical to Figures 2L and 2N) from (G) adult mouse sorted spermatogonia and (H) adult human sorted spermatogonia are colored by cell state and illustrate biologicallysignificant differences acrossthistrajectory, which is summarized tothe right ofeach plot. Inset graph in (G) showsthe distribution (percentage) ofthe sorted ID4-EGFPbright spermatogonia and ID4-EGFPdim spermatogonia as shown in Figures 2O and 2P, among the noted five spermatogonial states.