
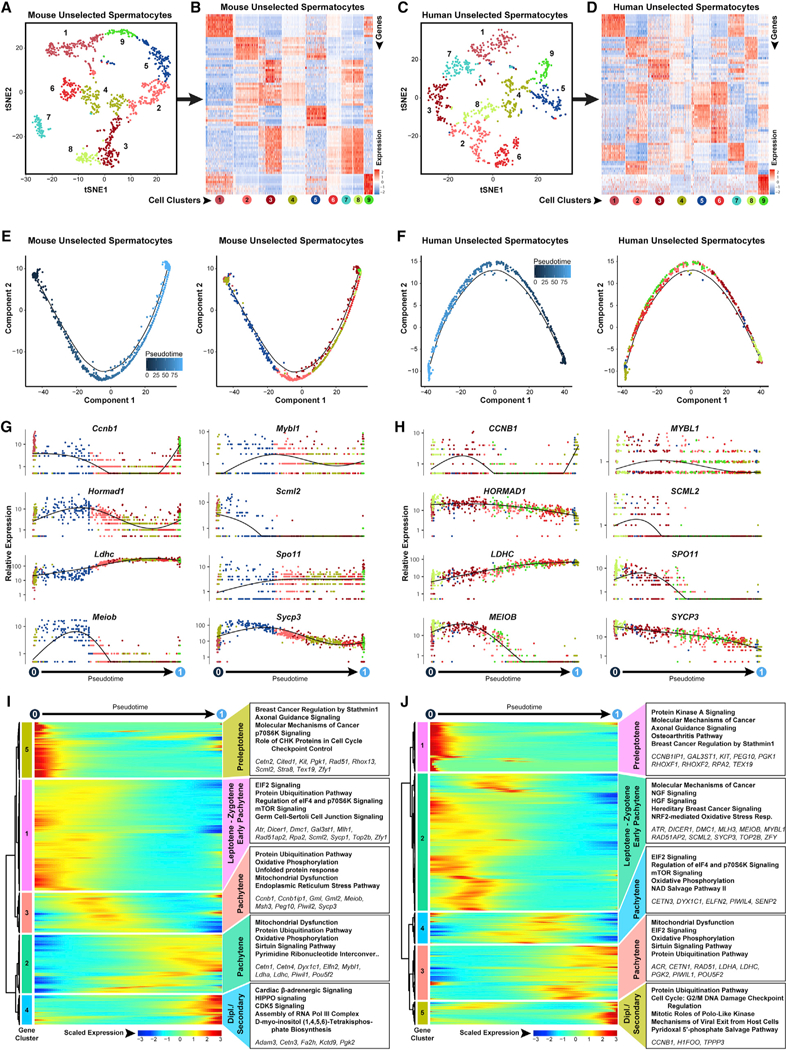
Figure 4. Meiotic Progression among Steady-State Spermatocytes Is Characterized by Regulation of Dynamic Metabolic Transitions and Protein Turnover.
Clusters of steady-state spermatogenic cellsthat contained spermatocytes (Figure 1 Amouse clusters 6,8,9, and 10; Figure 1B human clusters 7, 9,12, and 14) were extracted and re-analyzed here.
(A and C) The tSNE plots show unbiased re-clustering of unselected spermatocytes from (A) mouse testes and (C) human testes, with color distinguishing clusters.
(B and D) Heatmaps show the top 10 significantly differentially expressed genes (DEGs) between each cell cluster for (B) mouse and (D) human unselected spermatocytes. Gene lists can be found in Table S1. Colors and numbering of circles below heatmaps match the cell clusters in the corresponding tSNE plot.
(E and F) Single-cell transcriptomes from (E) mouse unselected spermatocytes and (F) human unselected spermatocyteswere subsequently used for unbiased dynamic lineage analysis producing cell trajectories ordered in pseudotime (left) and cells colored according to tSNE cell cluster (right).
(G and H) Expression levels (vertical axis) of key genes among (G) mouse unselected spermatocytes and (H) human unselected spermatocytes ordered in pseudotime (cell coloring is according to tSNE clusters from A and C, respectively).
(I and J) Heatmaps show hierarchical relationship between clusters of genes that were differentially expressed across pseudotime from (I) mouse unselected spermatocytes and (J) human unselected spermatocytes (scaled expression according to legend; see Table S2). The top five over-represented biological pathways from GO analyses of each cluster are noted at the right in bold (see Table S3), and key genes are italicized