
Figure 6. Neonatal Mouse Spermatogonia Exhibit Unique Developmental Characteristics during the First Wave of Spermatogenesis.
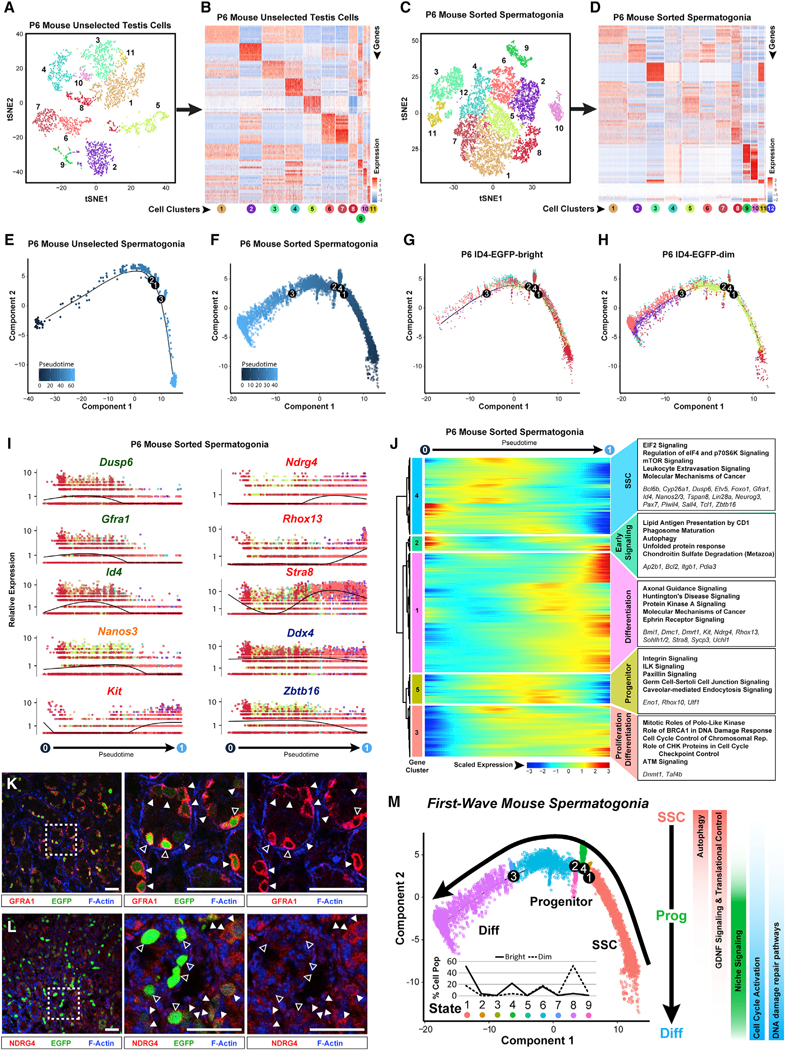
Unselected testis cells (containing a mixture of spermatogonia and testicular somatic cells) and sorted spermatogonia from P6 mouse testes were profiled by 10x Genomics analysis.
(A and C) Resulting tSNE plots show unbiased clustering of (A) P6 mouse unselected testiscellsand (C) sorted P6 sorted spermatogonia, with colordistinguishing clusters.
(B and D) Heatmaps show the top 10 significantly DEGs between each cell cluster for (B) P6 mouse unselected testis cells and (D) P6 mouse sorted spermatogonia. Gene lists can be found in Table S1. Colors and numbering of circles below heatmaps match the corresponding tSNE plot.
(E and F) Clusters of cells containing spermatogonia from (E) unselected P6 mouse testis cells (clutster 5 from A and B) or (F) sorted P6 mouse spermatogonia (clusters 1–9 from C and D) were subsequently used for unbiased dynamic lineage analysis producing cell trajectories with cells ordered in pseudotime.
(G and H) Retrospectively, (G) ID4-EGFPbr’9ht and (H) ID4-EGFPdim subpopulations contained within the sorted spermatogonia trajectory were displayed on the trajectory in isolation.
(I) Expression levels (vertical axis) of key genes among P6 sorted spermatogonia ordered in pseudotime (cell coloring is according to tSNE clusters from C). Similar plots for P6 mouse unselected spermatogonia are shown in Figure S6D.
(J) The heatmap shows hierarchical relationship between clusters of genesthat were differentially expressed across pseudotimefrom P6 sorted spermatogonia (scaled expression according to legend; see Table S2). The top five over-represented biological pathways from GO analyses ofeach cluster are noted at the right in bold (see Table S3), and key genes are italicized.
(K and L) Red immunostaining for (K) GFRA1 or (L) NDRG4 is shown together with green ID4-EGFP epifluorescence and blue F-actin counterstain (phalloidin) in sections of P6 Id4-Gfp testes (bar represents 50 μm; open arrowheads represent EGFPbright; solid arrowheads represent EGFPdim).
(M) The P6 spermatogonial trajectory (identical to Figure 6F) is colored by cell state and illustrates biologically significant differences across pseudotime and significant pathways are summarized to the right. Inset graph shows the distribution (percentage of the sorted ID4-EGFPbright spermatogonia and ID4-EGFPdim spermatogonia) as shown in (G) and (H), among the noted nine spermatogonial states.