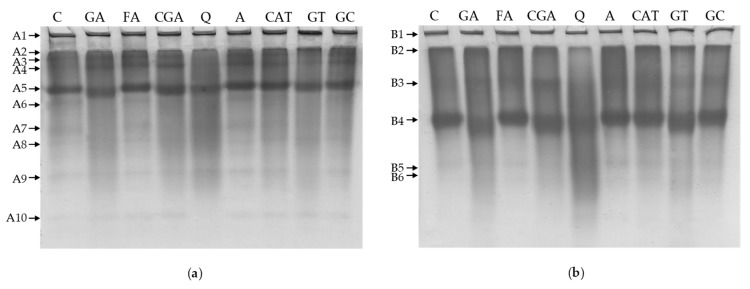
Figure 6.
The effect of phenolic compounds on the Native-PAGE profile of: (a) albumins; (b) globulins. C–control sample, GA, FA, CGA, Q, A, CAT, GT, GC–protein samples after incubation with gallic acid, ferulic acid, chlorogenic acid, quercetin, apigenin, catechin, green tea, and green coffee extracts, respectively; A1–A10: bands detected for albumins, B1–B5: bands detected for globulins.

