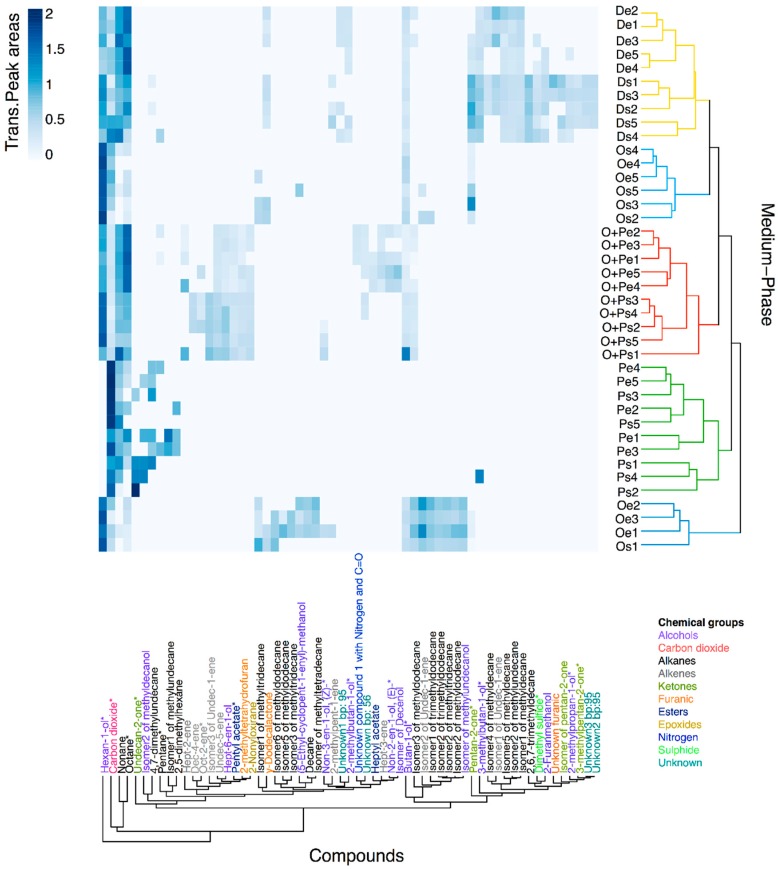
Figure 3.
A heatmap of Hellinger transformed and Pareto-scaled peak areas from 61 tentative annotated volatiles found in an M. furfur analysis using HS-SPME/GC-MS. Dendrograms represent similarities between samples (objects) and VOCs (variables) using Euclidean distances as a measure. Clusters of medium-phase samples were coloured according to the four growth media, while the compounds were coloured according to the chemical group. Compounds with * represent VOCs reported previously to be released by other Fungi in the mVOC 2.0 Database.

