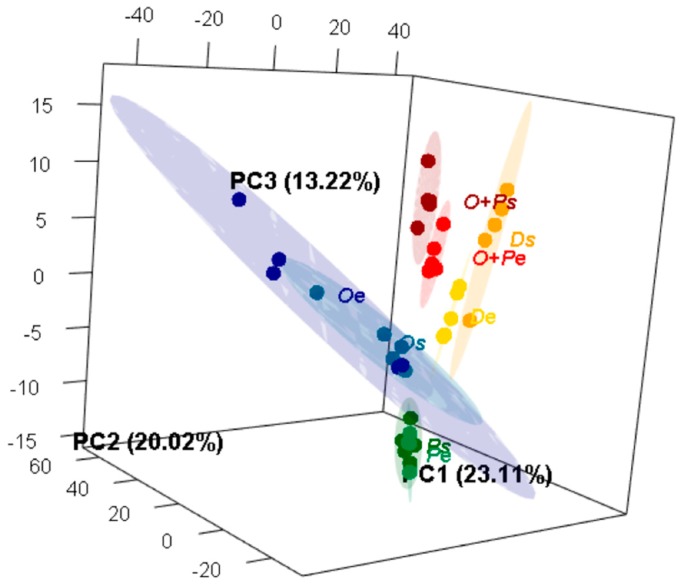
Figure 4.
Three-dimensional Principal Component Analysis (PCA) of the volatiles profiles of M. furfur growing in eight different experimental treatments. The ellipses in this plot are confidence intervals of 95% using a normal distribution. For more details about the data distribution in the three axes, see the three-dimensional animation in Figure S2.

