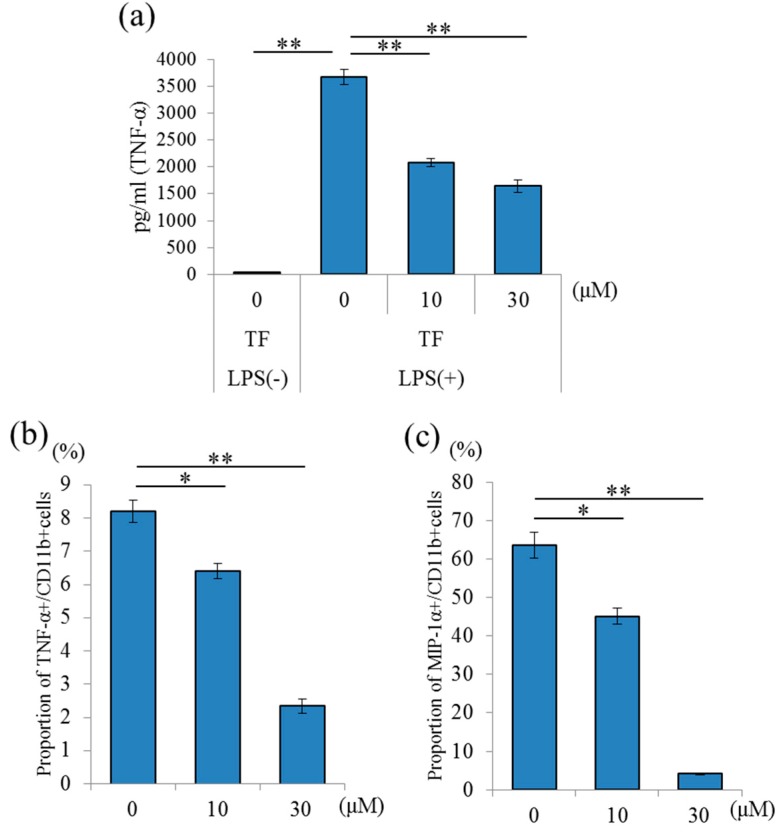
Figure 3.
Effects of in vitro theaflavins (TF) treatment on microglial anti-inflammatory activity. (a), Amount of TNF-α in the supernatant of microglia pretreated with 0, 10, or 30 μM TF and treated with 5 ng/mL LPS and 0.5 ng/mL IFN-γ. (b,c) Intracellular cytokine production in microglia pretreated with 0, 10, or 30 μM TF and treated with a leukocyte activation-cocktail with BD GolgiPlug. Scatter plots and percentages of macrophage inflammatory proteins (MIP)-1α- and TNF-α-producing cells in CD11b-positive cells, respectively. Columns and bars represent the means and SEs of triplicate wells per sample, respectively. The p values shown were calculated using the Student’s t-test (LPS [−] vs. [+] at 0 μM TF) and one-way ANOVA followed by Dunnett’s test (LPS [+] at 0 μM TF vs. LPS [+] at 10 and 30 μM TF). * p < 0.05 and ** p < 0.01.

