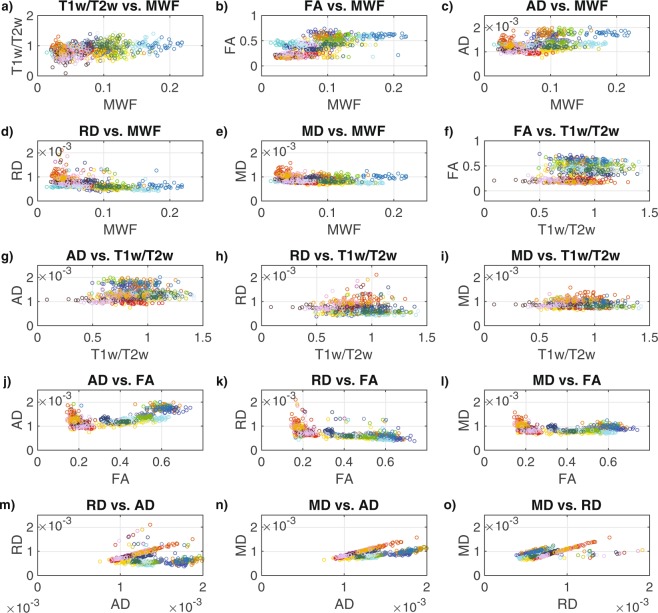
Figure 4.
Scatter plots between the MRI measures across all 25 bilateral ROIs: (a) T1w/T2w vs. MWF, (b) FA vs. MWF, (c) AD vs. MWF, (d) RD vs. MWF, (e) MD vs. MWF, (f) FA vs. T1w/T2w, (g) AD vs. Tw/T2w, (h) RD vs. Tw/T2w, (i) MD vs. Tw/T2w, (j) AD vs. FA, (k) RD vs. FA, (l) MD vs. FA, (m) RD vs. AD, (n) MD vs. AD and (o) MD vs. RD. Each structure is indicated by a different color in order to match the ROIs shown in Fig. 1, and the values for each participant are represented by individual dots.

